




























Views
Downloads




Complete Correlation & Slope Worksheet | Grade 12 Statistics

Paste this activity's link or code into your existing LMS (Google Classroom, Canvas, Teams, Schoology, Moodle, etc.).
Students can open and work on the activity right away, with no student login required.
You'll still be able to track student progress and results from your teacher account.
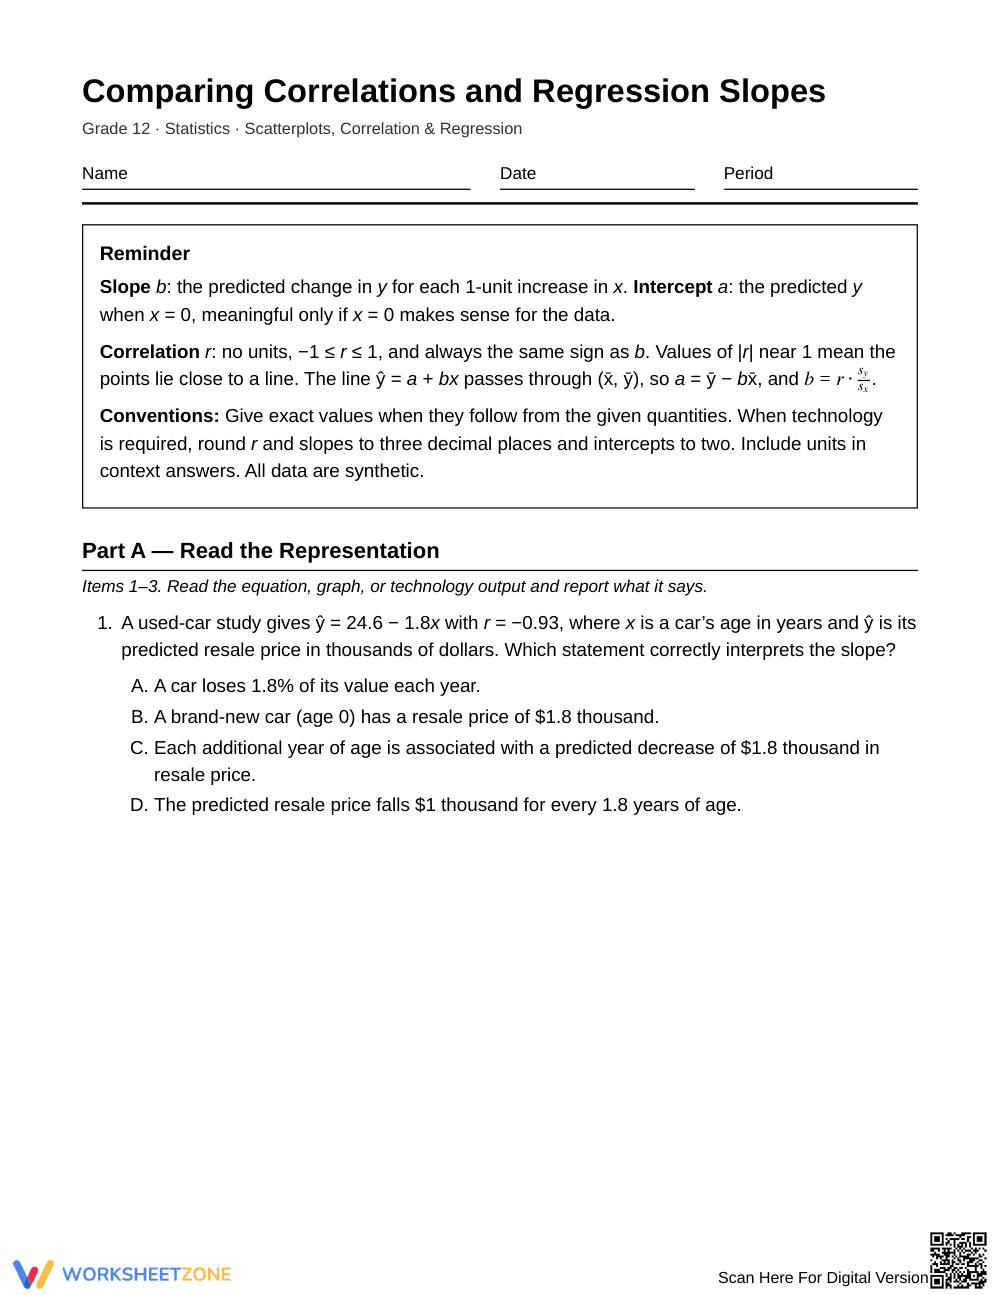
This worksheet helps Grade 12 statistics students compare correlation and regression slope. Students learn that r measures how closely points follow a line, while b measures how steeply the line rises. They read, translate, and critique representations, then explain in context whether a slope and a correlation agree.
At a Glance
- Grade: 12 · Subject: Statistics
- Standard: Scatterplots, correlation & regression — interpret slope and r, and judge whether they agree
- Skill Focus: Compare correlations and regression slopes
- Format: 5 pages · 12 problems · Answer key included · PDF
- Best For: Unit practice on regression interpretation
- Time: 30–40 minutes
What's Inside
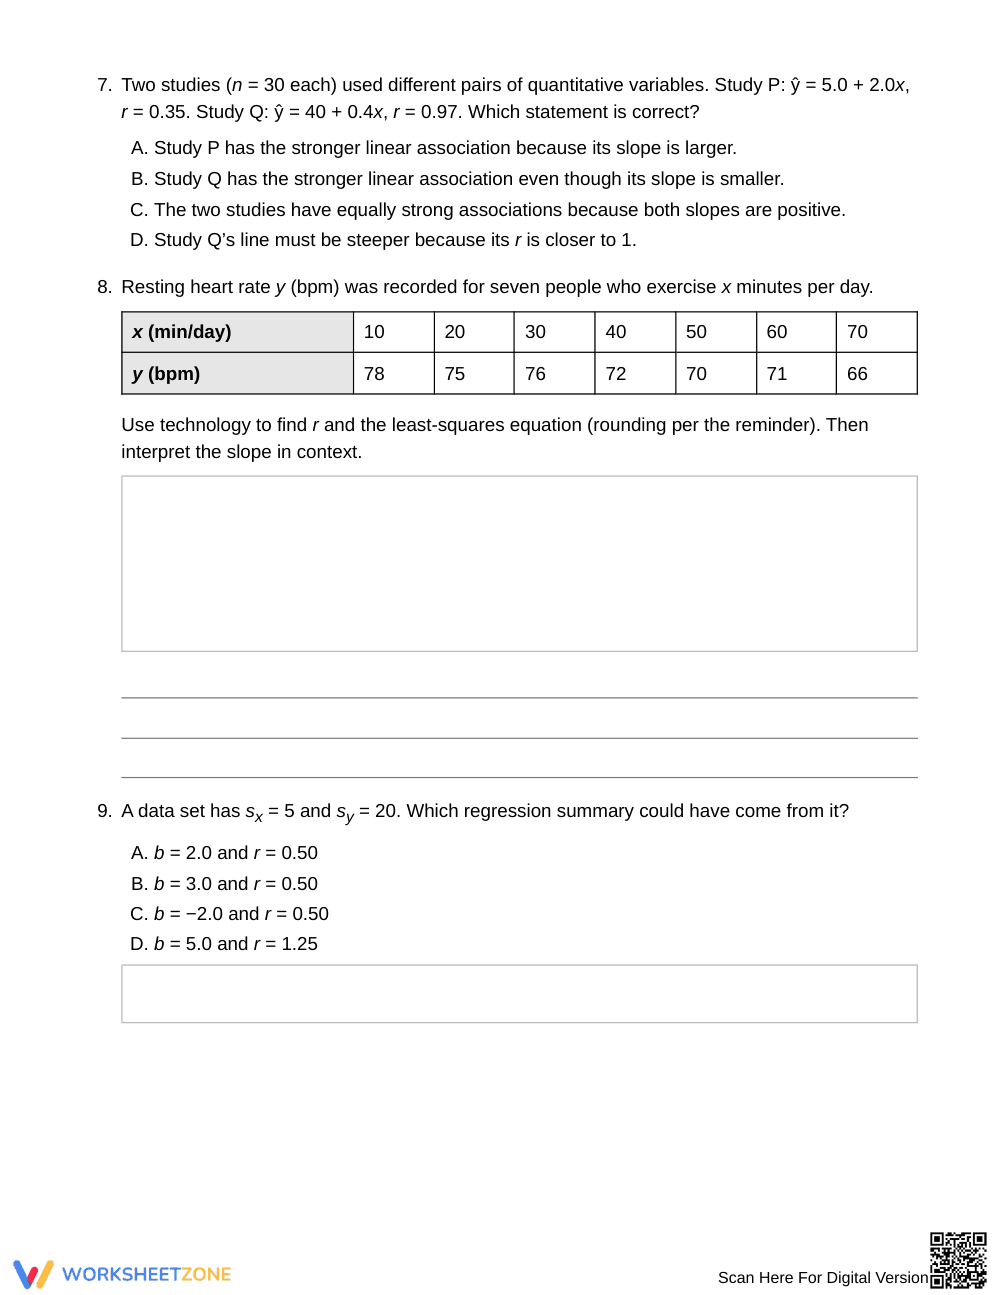
The worksheet has 12 items across three parts: multiple-choice questions, a graph with a fitted line, technology output, a data table, and written explanations. A reminder box at the top gives the slope, intercept, and r relationships, including b = r·sy/sx. A 3-page answer key is included. All data are synthetic.
Skill Progression
- Guided practice (Items 1–3): Read an equation, a graph, and technology output, and report what each says. The reminder box supports every step.
- Supported practice (Items 4–9): Convert between summary statistics, equations, tables, and verbal descriptions, including a unit-change table and one technology task.
- Independent practice (Items 10–12): Decide whether representations agree and justify the answer in complete sentences.
The sequence follows gradual release: I Do, We Do, You Do.
Standards Alignment
The worksheet addresses the Grade 12 statistics expectation that students interpret the slope and intercept of a least-squares line in context, use correlation to describe the direction and strength of a linear association, and distinguish what each statistic tells them. Use your state or district scatterplot and regression standards when mapping it to lesson plans, IEP goals, or curriculum tools.
How to Use It
- After direct instruction: Assign Parts A and B as in-class practice. Circulate and check whether students attach units to every slope interpretation.
- Review or homework: Assign Part C before a quiz. Look for students who confuse r with slope.
Expect 30–40 minutes to complete all 12 items.
Who It's For
This worksheet suits Grade 12 Statistics and AP-style courses after students have met scatterplots, r, and least-squares lines. Students who need more support can use the reminder box and work through Part A first. Pair it with a lesson on the relationship b = r·sy/sx.
Comparing correlations and regression slopes is a core Grade 12 statistics skill: students interpret the slope b as the predicted change in y per 1-unit increase in x, interpret r as a unitless measure of linear strength, and decide whether the two agree. This 12-item worksheet moves from reading equations, graphs, and technology output, to translating between summary statistics using b = r·sy/sx, to critiquing claims in which slope and correlation are confused. Its structure follows the gradual release model described by Fisher & Frey (2014), shifting from guided reading of representations to independent written explanation. A built-in reminder box, synthetic data, and a 3-page answer key make it practical for classroom practice, review, or formative checks, with units and context required in every interpretation. Use it to build precise statistical language.


