




























Complete Concentration Worksheet | Grade 9–12 Science
Paste this activity's link or code into your existing LMS (Google Classroom, Canvas, Teams, Schoology, Moodle, etc.).
Students can open and work on the activity right away, with no student login required.
You'll still be able to track student progress and results from your teacher account.
This Grade 9–12 chemistry worksheet builds conceptual mastery of solution concentration by connecting microscopic particle models, quantitative molarity calculations, spectrophotometry data, and thermal energy changes. Students evaluate 39 targeted tasks to distinguish between total solute quantity and solution concentration across authentic laboratory scenarios.
At a Glance
- Grade: Grades 9–12 · Subject: Science
- Standard: Analyze solution concentration using particle models, molarity math, and experimental evidence
- Skill Focus: Multi-representational solution concentration analysis
- Format: 4 pages · 39 problems · Answer key included · PDF
- Best For: Chemistry unit review and concept reinforcement
- Time: 45–60 minutes
What's Inside
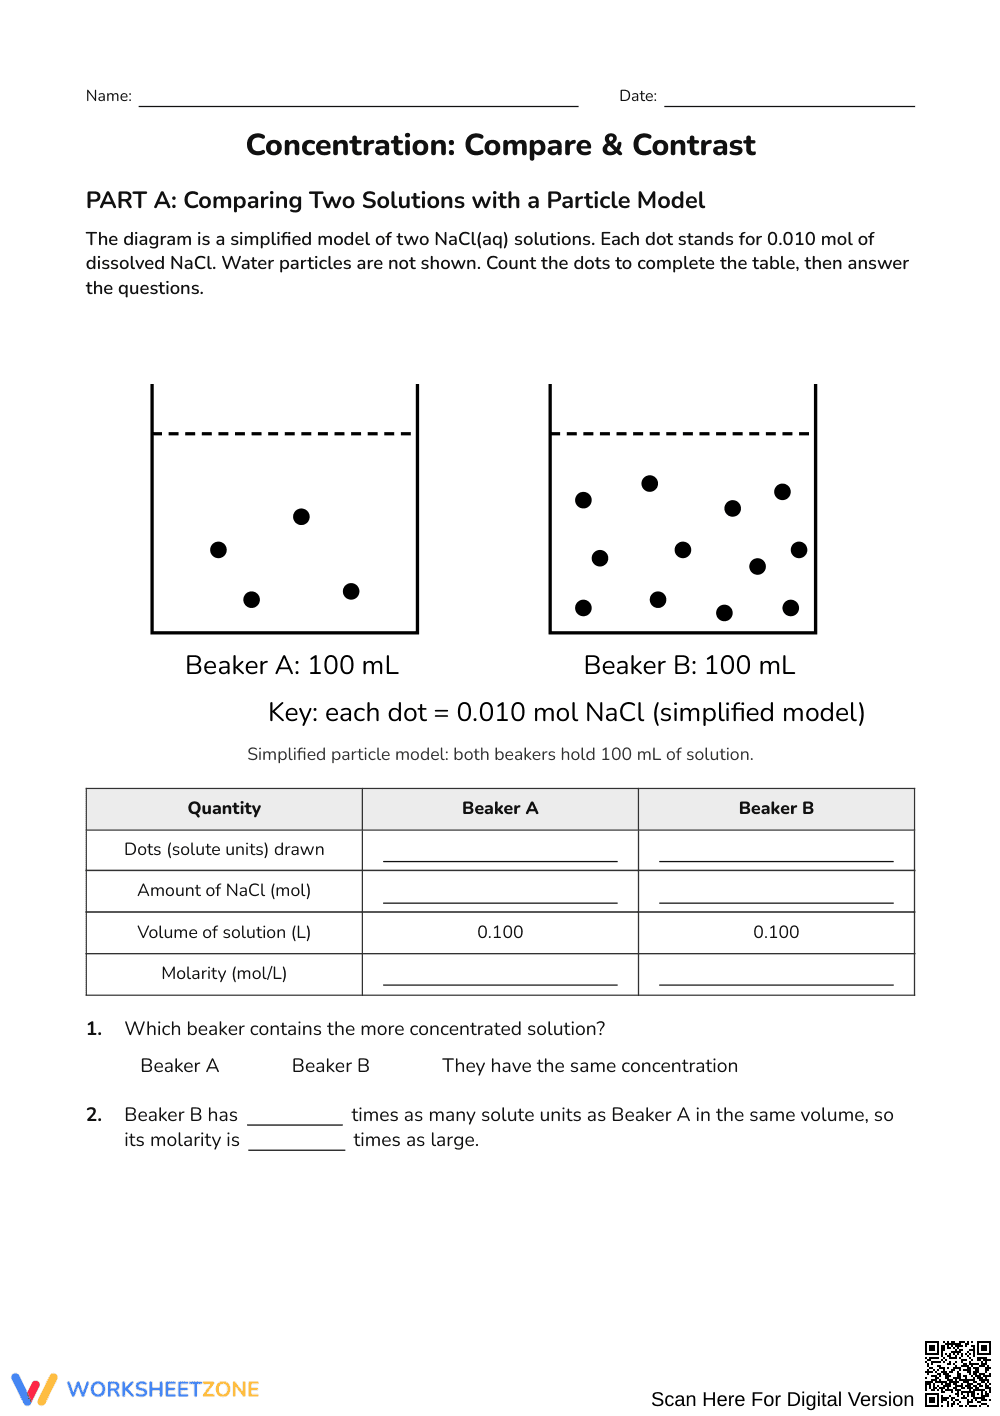
The 4-page worksheet guides learners through four distinct analytical contexts. Students analyze submicroscopic particle diagrams of sodium chloride, compute molarity values across differing solution volumes, read colorimeter absorbance curves for copper(II) sulfate, and evaluate temperature data from dissolution reactions. It includes complete data tables, multiple-choice checks, graphical interpretation tasks, and a full 4-page answer key.
Skill Progression
- Guided practice (Part A, 8 items): Students count particle dots in visual beakers, calculate molarity, and explain how particulate packing reflects concentration at low scaffolding.
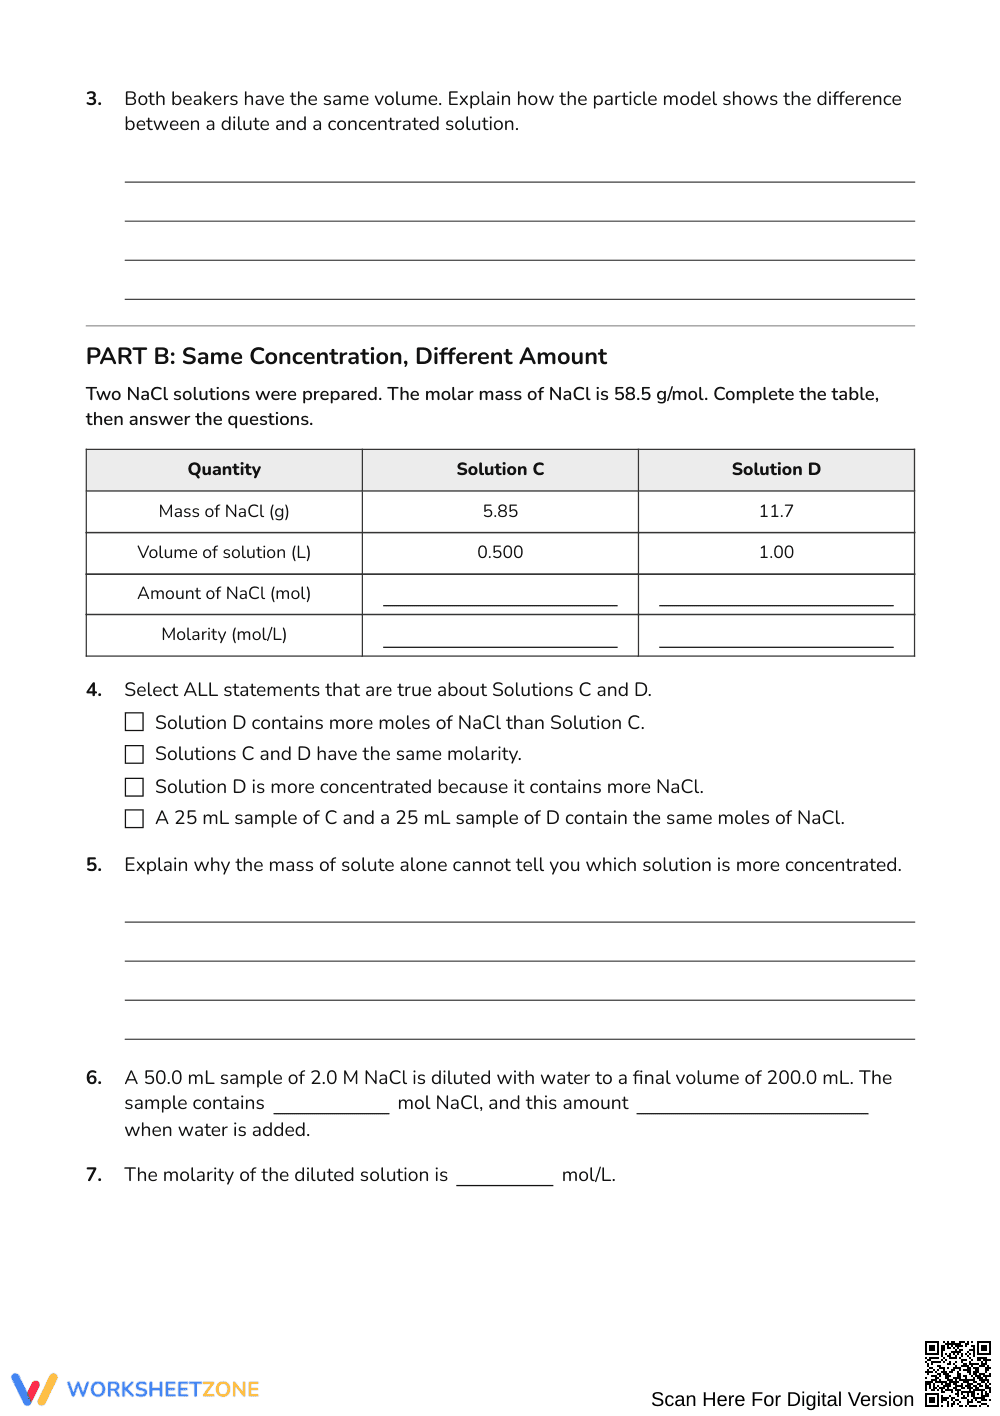
- Supported practice (Parts B & C, 18 items): Learners evaluate mass versus concentration, calculate dilution molarity, and interpret a linear Beer's law absorbance graph.
- Independent practice (Part D, 13 items): Students calculate molarities of dissolving salts, classify energy transfers, and write evidence-based evaluations of student misconceptions.
This sequence follows a gradual-release framework, transitioning learners from visual models to abstract calculations and data-driven scientific arguments.
Standards Alignment
This resource aligns with high school physical science standards addressing the quantitative and particulate nature of chemical solutions. Students calculate solution concentrations, model particle interactions, and analyze experimental data to draw valid conclusions. The curriculum expectations address both proportional reasoning in chemical formulas and thermochemical energy changes during dissolution.
How to Use It
Deploy this worksheet after direct instruction on molarity formulas and particle representations. It serves as an in-class collaborative activity where pairs verify calculations before writing short explanations. During the activity, conduct formative assessment observations by checking Part B to confirm students do not equate total mass directly with concentration. Expected completion time is 45 to 60 minutes.
Who It's For
This activity is designed for high school chemistry and physical science students developing qualitative and quantitative reasoning. It provides structured scaffolding for emerging problem solvers while offering rigorous analytical prompts for advanced learners. Pair this worksheet with an interactive solution simulation or a hands-on colorimetry laboratory investigation.
According to Fisher & Frey (2014), structured instructional progressions that guide students from concrete models to independent data evaluation significantly enhance scientific literacy and conceptual retention. This Grade 9–12 science worksheet reinforces solution concentration by linking particulate representations, molarity computations, and experimental data interpretation across 39 scaffolded prompts. By systematically confronting common misconceptions—such as confusing total dissolved solute mass with concentration or linking temperature change magnitude solely to concentration—students develop robust conceptual models supported by empirical evidence. The purposeful gradual-release architecture moves learners from counting particulate units in fixed volumes to evaluating Beer's law absorption graphs and thermodynamic dissolution data. Incorporating structured partner discussions alongside these analytical tasks solidifies quantitative proportional reasoning in chemical systems, helping high school learners synthesize mathematical calculations with physical observations to achieve comprehensive chemistry mastery as well as college readiness.


