



























Complete Climate Records Worksheet | Grade 12 Earth Science
Paste this activity's link or code into your existing LMS (Google Classroom, Canvas, Teams, Schoology, Moodle, etc.).
Students can open and work on the activity right away, with no student login required.
You'll still be able to track student progress and results from your teacher account.
This Earth science worksheet trains high school seniors to interpret temperature-and-precipitation records using thermodynamic energy balance principles. Students evaluate coastal maritime and continental interior data, calculate warming trends across six decades, and assess station bias, building the quantitative data literacy required for college-level atmospheric science and environmental engineering coursework.
At a Glance
- Grade: 12 · Subject: Environmental & Earth Science
- Standard: Atmospheric Systems — Analyze meteorological data records to evaluate regional climate patterns and decadal trends
- Skill Focus: Interpret Temperature-and-Precipitation Records and Energy Balances
- Format: 5 pages · 10 structured problems · Comprehensive answer key included · Printable PDF
- Best For: Advanced climate data analysis and exam review
- Time: 45–60 minutes
What's Inside
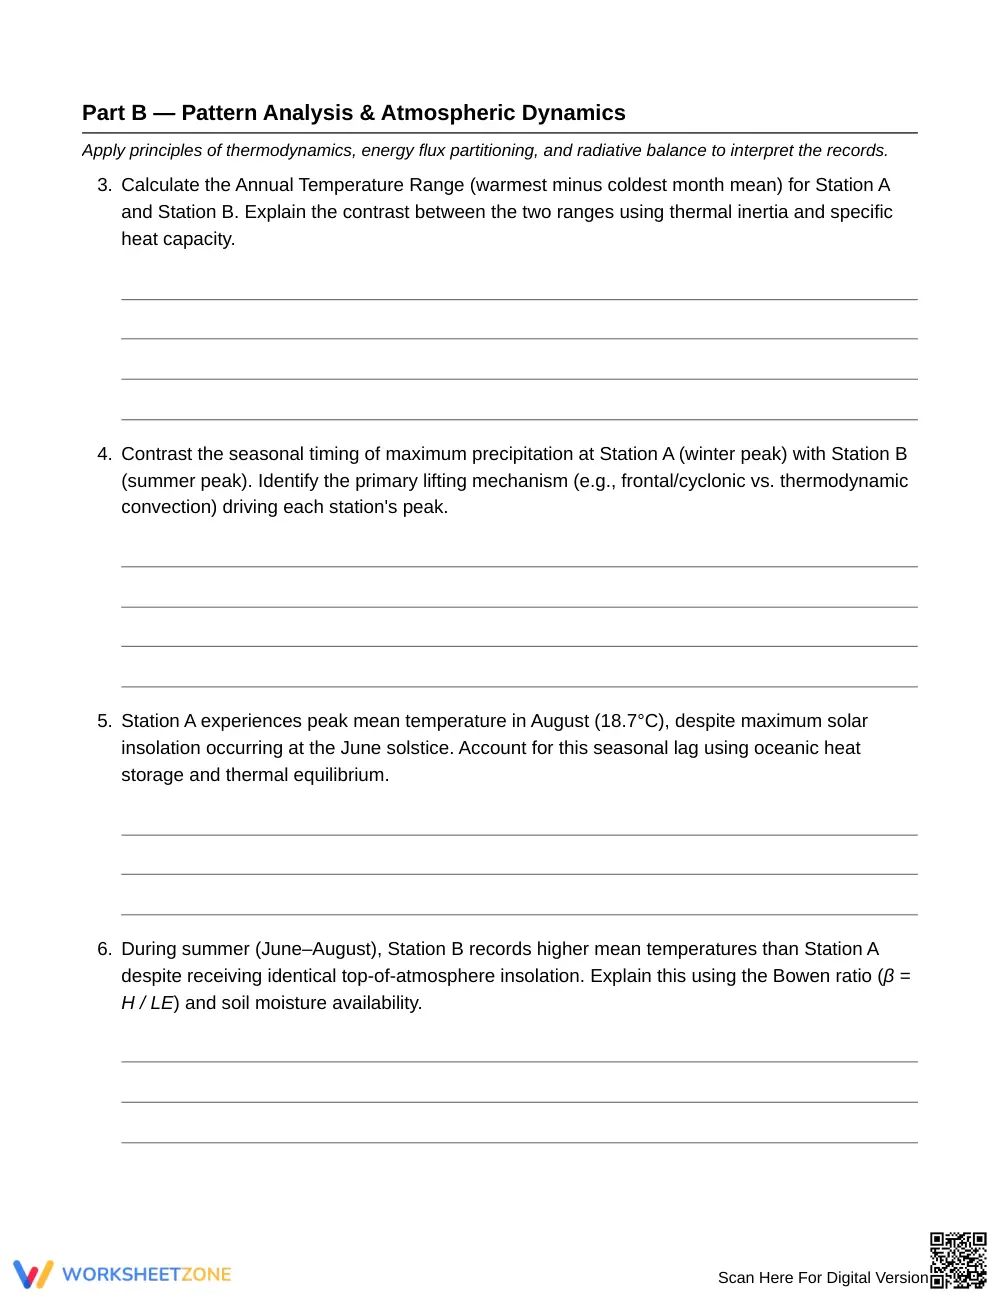
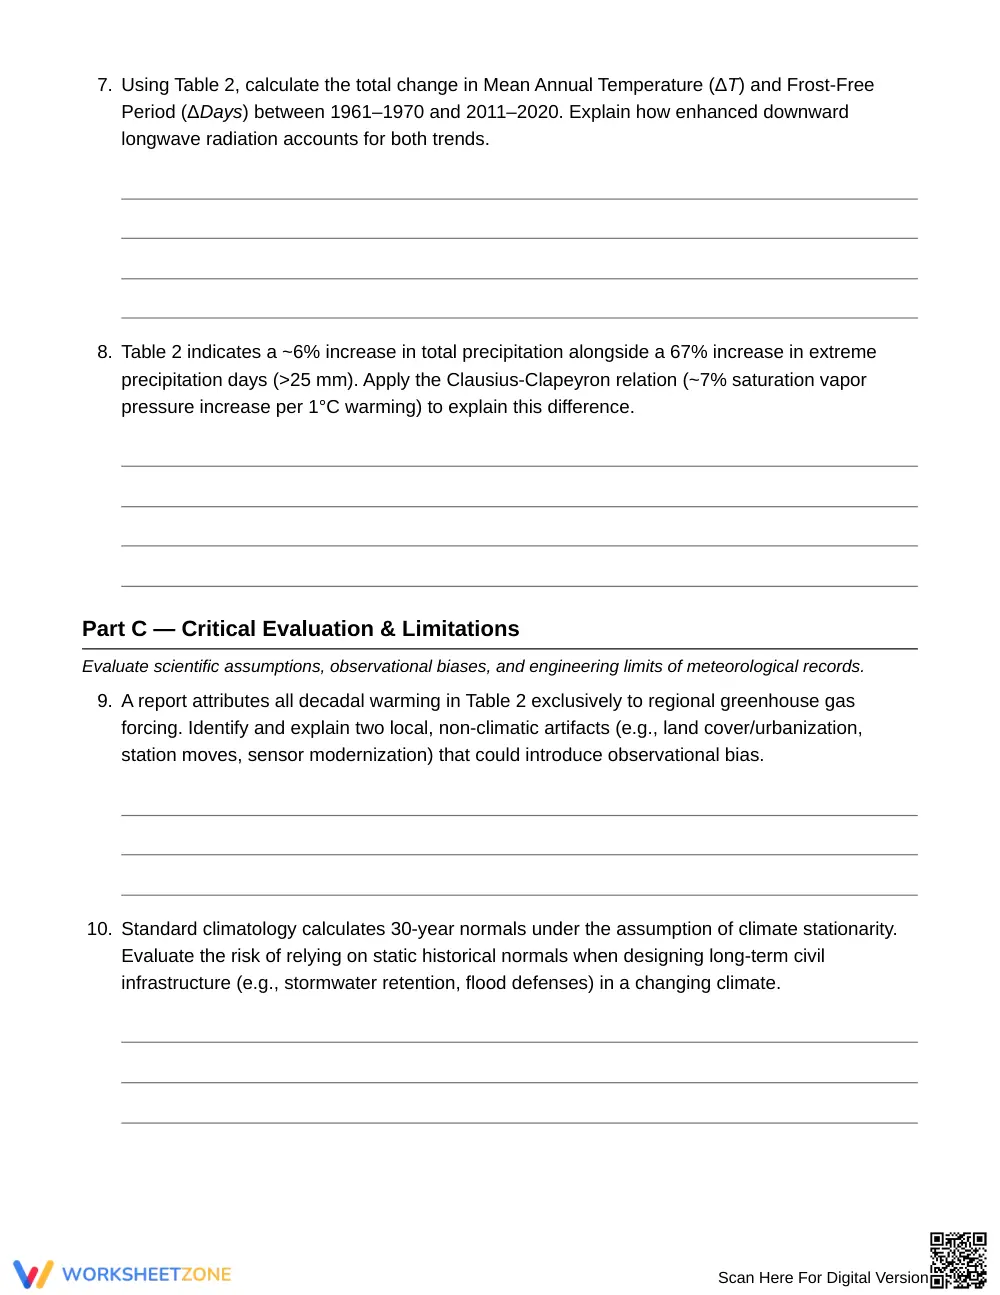
This 5-page worksheet provides two multi-variable climate data tables accompanied by 10 analytical problems. A core principles header defines terrestrial energy balance, sensible versus latent heat flux, and the Bowen ratio. The comprehensive 3-page answer key provides complete numerical solutions, thermodynamic explanations, and evaluation criteria for assessing historical observational limits.
Skill Progression
- Guided practice (Part A — 2 tasks): Students identify baseline monthly extremes and extract decadal precipitation metrics directly from data tables.
- Supported practice (Part B — 6 tasks): Learners apply specific heat capacity, the Bowen ratio, and Clausius-Clapeyron scaling to explain thermal lags and decadal shifts.
- Independent practice (Part C — 2 tasks): Students critically evaluate station artifacts, observational bias, and the limitations of assuming climate stationarity in engineering.
This progression embodies the gradual-release framework, advancing students from foundational data retrieval to independent scientific evaluation.
Standards Alignment
This resource aligns with high school Earth and Space Science standards requiring students to analyze geoscience data to understand atmospheric energy flow and climate variability. Supporting concepts address quantitative mathematical modeling and infrastructure engineering constraints. These curriculum standards can be copied directly into lesson plans, IEP goals, or district mapping tools.
How to Use It
Assign this worksheet following direct instruction on terrestrial radiation balance and oceanic thermal inertia. It functions effectively as a collaborative data lab or an independent unit assessment. Formatively check whether students attribute Station A's August temperature peak to marine heat capacity rather than solar timing. Students typically complete the 10 tasks in 45 to 60 minutes.
Who It's For
This activity targets Grade 12 Earth and Space Science and AP Environmental Science students mastering quantitative climatology. For differentiated support, provide the Bowen ratio formula sheet; for extension, prompt students to research real-world station relocation biases. Pair this resource with a laboratory investigation on water's specific heat or atmospheric circulation cells.
According to research by Fisher & Frey (2014), scaffolding secondary science instruction through structured empirical data analysis, thermodynamic modeling, and open-ended critique significantly accelerates student conceptual mastery of complex Earth systems. This Grade 12 climatology resource operationalizes that instructional architecture through interpreting temperature-and-precipitation records across distinct maritime and continental climate regimes. Students examine 30-year climatological normals, apply the Bowen ratio to explain seasonal heat flux differences, and calculate multi-decadal temperature shifts alongside extreme precipitation frequency across 60 years of synthetic meteorological observations. Furthermore, by evaluating non-climatic station artifacts and critiquing historical stationarity assumptions in civil engineering design, learners bridge empirical geoscience with real-world infrastructure challenges. The included 3-page answer key provides complete mathematical calculations and thermodynamic rationales, helping educators pinpoint and remediate student misconceptions regarding sensible heat, latent heat, and saturation vapor pressure dynamics in upper-level classrooms.


