




























Views
Downloads



Complete Bivariate Data Worksheet | Grade 8 Math

Paste this activity's link or code into your existing LMS (Google Classroom, Canvas, Teams, Schoology, Moodle, etc.).
Students can open and work on the activity right away, with no student login required.
You'll still be able to track student progress and results from your teacher account.
This Grade 8 math worksheet builds student mastery in plotting and describing bivariate data. Middle school learners analyze scatter plots, identify linear and non-linear associations, write equations for informal lines of fit, identify outliers, and distinguish between reliable interpolation and risky extrapolation across 12 rigorous problems.
At a Glance
- Grade: 8 · Subject: Math
- Standard: Construct and interpret scatter plots for bivariate measurement data
- Skill Focus: Plot and Describe Bivariate Data
- Format: 5 pages · 12 problems · Answer key included · PDF
- Best For: Guided practice and skill mastery
- Time: 45–55 minutes
What's Inside
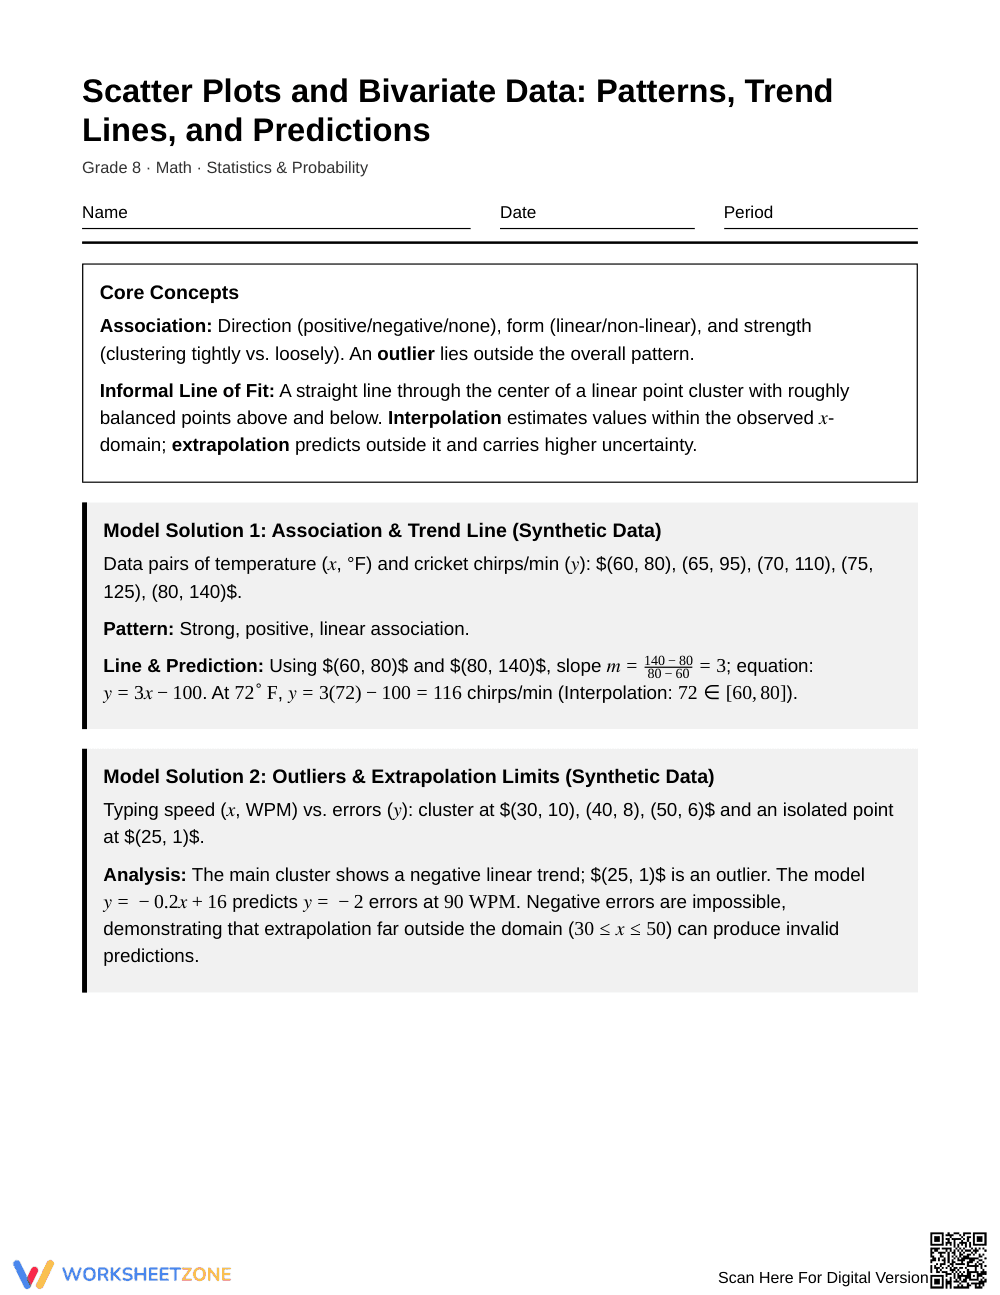
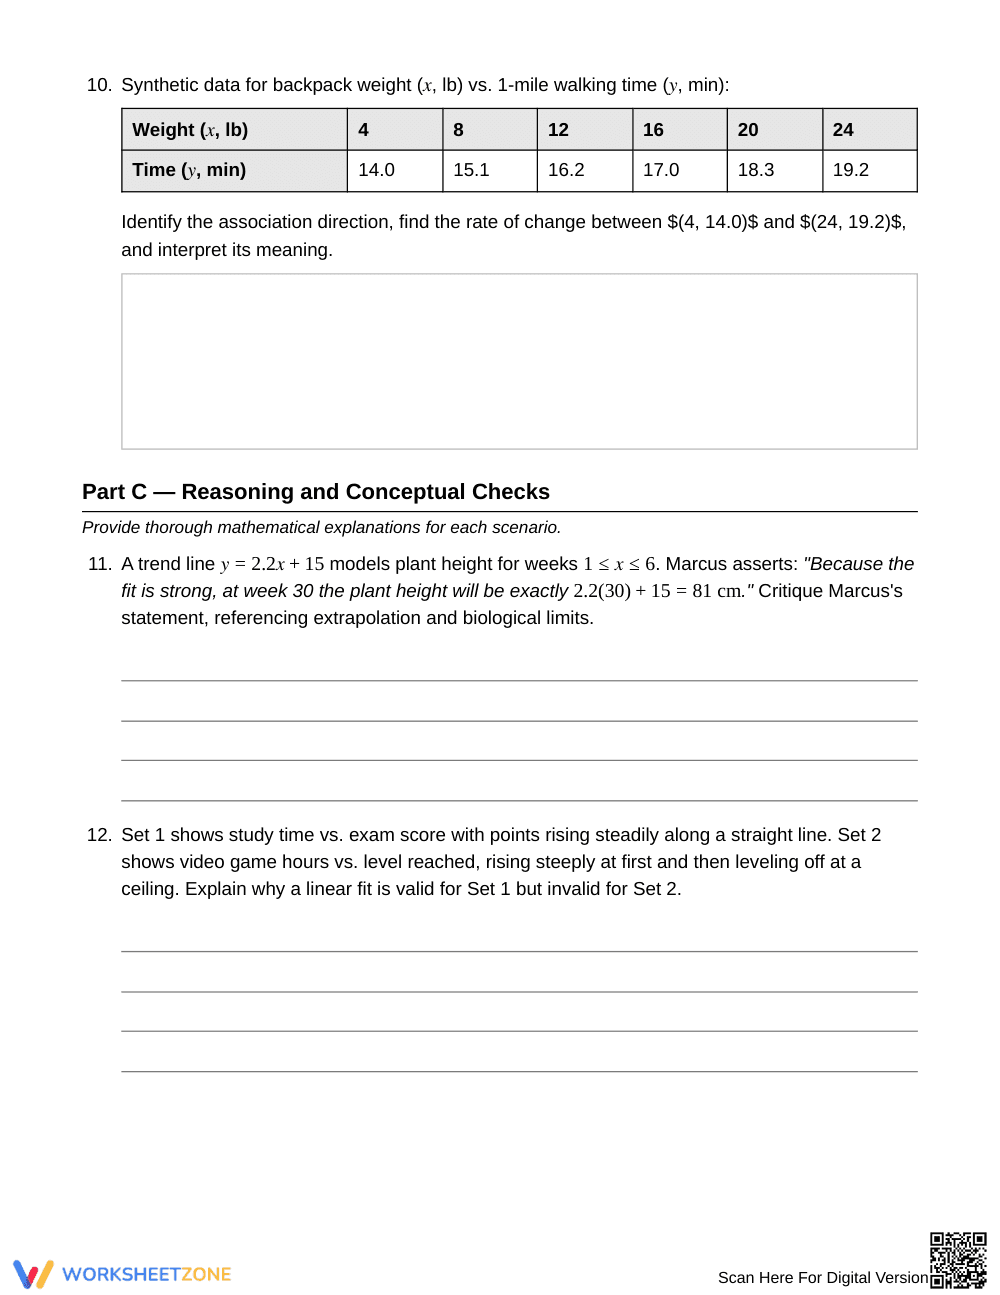
The 5-page resource provides core concept review, 2 detailed model solutions, and 12 distinct student tasks. Students encounter real-world synthetic scenarios such as temperature versus sales, study time versus exam scores, and motor voltage versus speed. A complete 2-page answer key provides step-by-step calculations, model linear equations, slope interpretations, and conceptual explanations.
Skill Progression
- Guided Practice (Part A, 4 items): Step-by-step missing-step blanks support learners in finding slopes, determining y-intercepts, identifying obvious outliers, and naming interpolation versus extrapolation.
- Supported Practice (Part B, 6 items): Independent problem solving prompts students to construct linear equations from coordinate pairs, interpret rates of change, and evaluate prediction reliability.
- Independent Practice (Part C, 2 items): High-level conceptual critique questions challenge students to evaluate extrapolation errors and explain linear versus non-linear domain boundaries.
This gradual-release structure moves students methodically from scaffolded computation to deep statistical reasoning.
Standards Alignment
This worksheet aligns with Grade 8 statistics and probability expectations for bivariate data analysis. Students investigate patterns of association between two quantities, fit informal trend lines, assess linearity, and use linear models to solve problems. Standard alignment details can be copied directly into lesson plans, IEP goals, or district curriculum mapping tools.
How to Use It
Deploy this worksheet after direct instruction on scatter plots and lines of fit. Use Part A for paired partner work during class, then assign Part B for independent desk work. During the activity, check whether students mistakenly extrapolate far outside the given data range when evaluating predictions. Expect students to complete the 12 items within 45 to 55 minutes.
Who It's For
This activity is designed for Grade 8 mathematics students learning statistics, as well as high school Algebra I students reviewing bivariate data modeling. Pair this worksheet directly with a scatter plot anchor chart and linear graphing direct instruction to reinforce coordinate interpretation and slope-intercept form.
Middle school mathematics standards prioritize bivariate data interpretation, requiring eighth-grade students to investigate patterns of association in scatter plots, fit trend lines, and evaluate model limitations. According to Fisher & Frey (2014), structured gradual-release frameworks that sequence guided completion tasks before unassisted conceptual critiques significantly improve student retention of quantitative modeling concepts. By transitioning from missing-step calculations in Part A to independent linear equation derivation in Part B and critical model evaluation in Part C, this 12-task worksheet supports rigorous statistical literacy. Learners not only calculate rates of change and plot points but also evaluate whether predictions represent sound interpolation or unreliable extrapolation. This multi-step instructional design ensures middle school students develop a deep conceptual foundation in linear modeling, data analysis, and domain constraints that prepares them for advanced high school algebra coursework.


