These measures of variation worksheets move students from finding the mean to actually reading what a data set is telling them — how tightly packed the numbers are, where the spread concentrates, and whether any values are pulling the distribution apart. The set covers range, interquartile range, mean absolute deviation, and standard deviation across middle and high school levels, with enough scaffolding that students can work through the steps without losing the conceptual thread.
What the Pages Actually Target
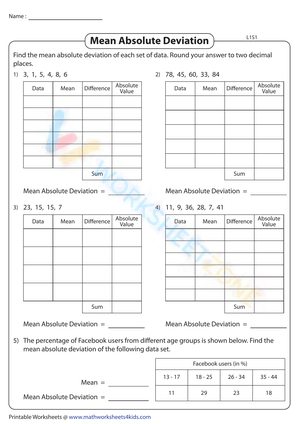
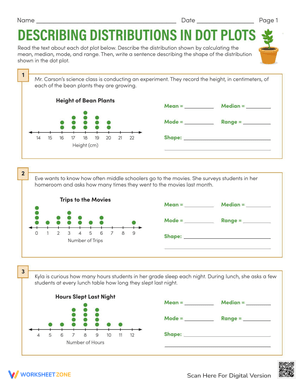
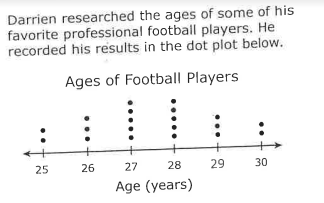
Each worksheet focuses on a specific measure rather than mixing all four into one page — a deliberate choice that keeps cognitive load manageable when students are still building procedural fluency. Range and IQR pages use whole-number data sets with 6–10 values; students order the data, locate quartiles, and calculate Q3 minus Q1 before answering short interpretation questions. Mean absolute deviation pages include a structured table where students record each data point, the mean, the absolute difference, and the running total — the table format reduces arithmetic errors and makes the multi-step process visible.
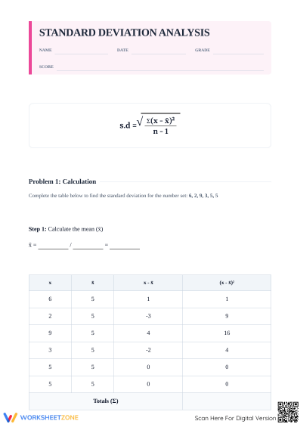
The standard deviation pages, intended for high school courses, follow the same table-based structure: students compute deviations from the mean, square each one, sum the squared deviations, divide by n or n−1 depending on whether the problem specifies population or sample, and take the square root. Word problems on these pages ask students to interpret the result — not just calculate it — which is where genuine statistical reasoning begins.
The Error Patterns Worth Knowing Before You Distribute These
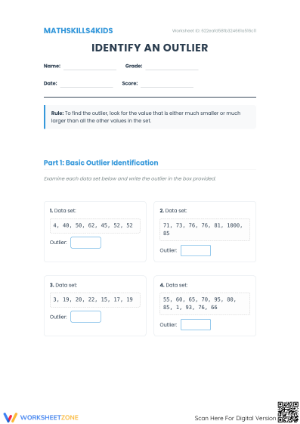
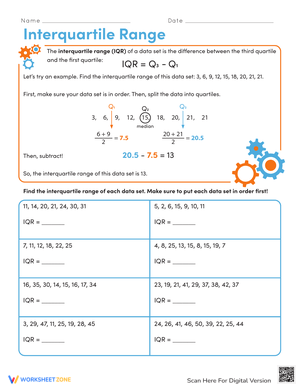
Students who have no trouble calculating the mean will still misplace quartiles when they first work with IQR. The most consistent error: when a data set has an even number of values, students include the median value in both halves before finding Q1 and Q3. A student working with {4, 7, 9, 12, 15, 20} will find the median of 10.5, then calculate Q1 from {4, 7, 9, 10.5} instead of {4, 7, 9}. The worksheets include a worked example at the top of the page that handles this case explicitly.
With MAD, the error that appears most often is skipping the absolute value step — students subtract each point from the mean, keep negative differences as negatives, and end up with a near-zero average that they accept without questioning. That error is almost always a sign the student doesn't yet understand what MAD is measuring. A brief class discussion before distributing the worksheet — asking students what would happen if positive and negative distances cancelled each other out — prevents most of those mistakes before they hit paper.
Standard deviation has its own predictable stumbling block: students calculate deviations correctly but forget to square them before summing, then take a square root that produces a nonsense result. The table columns are labeled clearly enough that most students catch this when they self-check, but it's worth pointing to the "square each difference" column explicitly during instruction.
Where These Fit in a Statistics Unit
The range and IQR pages work well the day after students build box plots — they already have the quartile positions marked and can pull the IQR directly from their own graph, which grounds the calculation in something visual. After that, MAD pages slot into the following class period as independent practice once the class has walked through two or three examples together on the board. The transition from IQR to MAD is a good place to ask students why we might want a measure that uses every data point rather than just the middle 50 percent — that question, even if you don't spend long on it, builds the conceptual foundation that makes standard deviation feel like a logical next step later on.
For teachers who use station rotations, these pages work well across four stations: one station on range and ordering data, one on IQR and outlier identification, one on MAD calculation, and one on interpretation questions drawn from any of the three measures. Fifteen-minute rotations leave enough time for students to complete a half-page without feeling rushed. The teacher can position themselves at the MAD station for the first two rotations, since that's where procedural confusion tends to concentrate.
How This Sits in the Standards
CCSS 6.SP.B.4 and 6.SP.B.5c are the anchor standards for this content at the middle school level. 6.SP.B.5c specifically asks students to describe the spread of a numerical data set in the context of how it was measured — that language about context is what the interpretation questions on these pages are designed to meet. Students aren't just asked to find the MAD; they're asked what a MAD of 3.4 means for a set of plant growth measurements, or whether a smaller IQR suggests more consistent performance.
At the high school level, the relevant standard is HSS-ID.A.2, which calls for comparing center and spread of two or more data distributions using standard deviation and IQR. Several of the more advanced pages include paired data sets for exactly this reason — students calculate standard deviation for both, then write a sentence comparing the variability. That writing prompt is a lightweight but effective formative check; a student who writes "Set A has a bigger standard deviation" with no further explanation hasn't internalized the meaning, while a student who connects the value to real-world consistency or risk has.
Scaling the Work for Different Learners
For students who aren't ready for multi-step MAD calculations, the range pages alone give them meaningful practice with the concept of spread. Pairing those students with a dot plot so they can see the data before calculating helps — students who freeze when looking at a bare list of numbers often do fine when they can see the distribution visually first.
For students who are ready to go further, a productive extension is having them calculate the IQR and the MAD for the same data set and then write a short comparison: which measure changed more when an outlier was added, and why? That question surfaces a real statistical principle — the robustness of IQR compared to MAD — without requiring any instruction beyond what they've already done. Students who complete this extension are prepared for the standard deviation work without needing a separate enrichment packet.
Frequently Asked Questions
1. When should I introduce standard deviation — 7th grade or wait until high school?
Most state standards place standard deviation firmly in high school (typically Algebra 2 or a dedicated statistics course), and there's good pedagogical reason for that placement. Students need comfort with summation notation and square roots before the formula is approachable. MAD does most of the same conceptual work at the middle school level and prepares students for the logic of standard deviation without the algebraic overhead. If you have an advanced 8th grade group and want to preview the concept, the standard deviation pages here can work — but treat it as enrichment rather than core instruction.
2. Is it better to teach population standard deviation or sample standard deviation first?
Introduce population standard deviation first, dividing by n. The formula is simpler, and most introductory problems use complete data sets. Once students can execute the steps reliably, explain that when we're working from a sample and trying to estimate a population parameter, we divide by n−1 to avoid underestimating variability. That explanation lands much better after students understand what they're dividing in the first place.
3. Can these worksheets function as a quiz or exit ticket?
The shorter pages — single-concept, 6–8 problems — work as exit tickets or brief formative checks. The full calculation pages, especially the MAD and standard deviation ones, are better suited to practice or homework, since they take 20–30 minutes to complete carefully. If you want a quick formative snapshot, the interpretation questions at the bottom of each page are easy to pull out and use on their own.