Biodiversity Worksheets PDF for 9th Grade
These biodiversity worksheets pdf for 9th grade give biology teachers a set of targeted, print-ready resources covering genetic variation, species-level measurements, ecosystem-scale diversity, and the primary human pressures driving species loss. The set moves students from foundational definitions into data analysis and, eventually, conservation policy evaluation — the full arc of a rigorous unit.
The Specific Skills Each Worksheet Targets
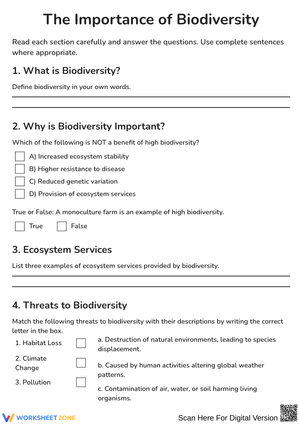
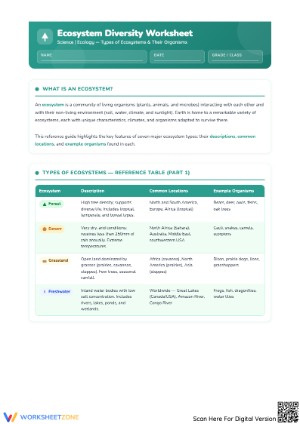
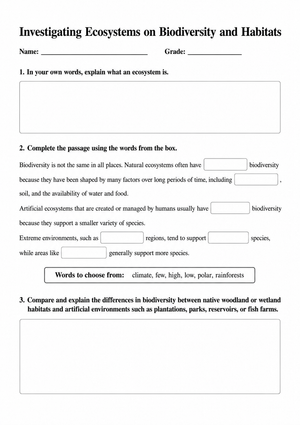
The three levels of biological diversity form the conceptual backbone of the set. Students distinguish genetic diversity from species diversity — a distinction that trips up more 9th graders than most teachers expect — and then scale up to ecosystem diversity, identifying biome characteristics, locating biodiversity hotspots on reference maps, and explaining why a hotspot must meet both endemism thresholds and habitat-loss criteria to qualify.
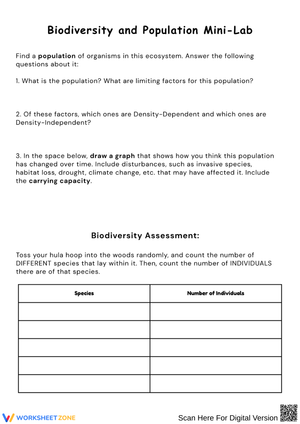
Species richness and species evenness receive separate, dedicated treatment. One worksheet asks students to work through simulated quadrat data to calculate both metrics for two contrasting habitats and then write a claim explaining which site shows greater species diversity. Another targets genetic diversity within a single population: students read allele frequency tables and predict which population faces higher extinction risk during an environmental bottleneck. Ecosystem services run through the later worksheets — students sort provisioning, regulating, cultural, and supporting services into categories and then trace how the destruction of a single coastal wetland disrupts multiple service types simultaneously.
Threats to biodiversity receive extended coverage through the HIPPCO framework — Habitat Loss, Invasive Species, Population Growth, Pollution, Climate Change, and Overexploitation. Each threat appears in a distinct context: a deforestation land-use scenario, a marine food chain for tracing biomagnification step by step, a phenology graph showing a migratory songbird's arrival date shifting earlier across six decades. Students do not just name the threats; they read data and construct evidence-based arguments about which pressures compound one another.
Student Errors Worth Catching Before the Unit Exam
The species richness and evenness distinction produces reliable errors. Students who correctly count the number of species in a habitat still frequently conclude that two habitats with identical species counts have equal biodiversity. Show them a table where Habitat A has eight species with roughly equal population sizes and Habitat B has eight species where one species makes up 90 percent of all individuals — most 9th graders will call those sites equivalent. The worksheet forces a comparison of both metrics before students write a conclusion, which surfaces the misunderstanding before the test does.
Genetic diversity is another consistent trouble spot. Students often assume a population with high genetic diversity must also have high species richness, conflating two distinct levels of the concept entirely. When a worksheet presents allele frequency data for a single-species population, a notable share of students will ask whether they should be counting multiple species instead. The question itself reveals exactly where the misconception lives.
On the HIPPCO framework, students frequently underrank habitat loss relative to climate change. Media coverage skews their intuition toward the more visible, long-term threat. When a worksheet asks them to rank threats by land area affected per decade using actual figures, most students recalibrate. Building that data-driven correction into your sequence explicitly is worth the planning time.
Building These Worksheets Into Your Biology Block
The biodiversity worksheets pdf for 9th grade work well as a tiered sequence across a two-to-three week unit. Open with the vocabulary and concept-mapping worksheet during direct instruction — students fill in definitions and connect examples alongside your lecture rather than taking unstructured notes. Then move to the species richness and evenness calculation worksheet as a guided class activity: model the math once, work through one example together, then release students to complete the parallel problems independently.
The HIPPCO case study worksheets are built for station rotations. Set up six stations, one threat per station, each with its worksheet, a short reading card, and a supporting graph or data table. Eight to ten minutes per station keeps groups moving. Because each worksheet is self-contained, a group that finishes early can strengthen their evidence sentences without waiting on another rotation to open up.
The ecosystem services and conservation policy worksheets belong near the end of the unit, used as performance tasks once students have enough factual grounding to argue a position rather than just recall definitions. Assign one as a formative check the class period before the unit exam so you can identify which concepts still need reteaching.
One pairing that consistently improves data comprehension: before students work through the species richness calculation worksheet, take ten minutes to go outside and count plant species in a marked one-meter square of the schoolyard. Students do not need to identify species by name — distinct leaf shapes count as distinct types. When they return and open the simulated quadrat data, the numbers have a physical referent. The difference between a species-rich plot and a depauperate one becomes intuitive rather than abstract, and that understanding holds when they later work through data at the ecosystem scale.
Standard Alignment
These worksheets connect most directly to NGSS HS-LS2-7, which asks students to design, evaluate, and refine solutions for reducing the impact of human activities on the environment and biodiversity. In classroom terms, that standard appears in the conservation policy tasks near the end of the unit, where students read a land-use scenario, assess a proposed solution, and write a revised recommendation grounded in evidence. The biodiversity worksheets pdf for 9th grade covering HIPPCO threats and ecosystem services build the factual base students need before they can engage with HS-LS2-7 at the analytical depth the standard requires.
NGSS HS-LS4-5 is also relevant, asking students to evaluate evidence for the role of group behavior on individual and species' survival chances. Worksheets addressing genetic diversity within populations connect here — particularly activities where students analyze how a population bottleneck reduces adaptive capacity and increases extinction risk across subsequent generations.
Adjusting the Worksheets for Your Range of Learners
Students who need additional support benefit from the concept-mapping worksheet used as an advance organizer before your lecture rather than after it. Providing the map with anchor terms already placed and asking students to add connecting examples — rather than constructing the map from a blank template — reduces cognitive load enough that more students arrive at the data analysis tasks genuinely ready to work.
For students working above grade level, the conservation policy worksheets have natural extension points built in. Instead of responding to a pre-written scenario, advanced students can research an actual international initiative — the Kunming-Montreal Global Biodiversity Framework is current and accessible at the 9th-grade reading level — and evaluate it against the criteria already printed on the worksheet. The extension fits inside the same structure, so it requires no additional materials to prepare.
The HIPPCO station worksheets are easy to tier without creating parallel versions. Assign all students the same analytical task but vary the accompanying data: simpler frequency counts for students who need more support, multi-variable datasets with percentage-change calculations for those who need more challenge. The worksheet structure stays consistent; the data source does the differentiating work.
Frequently Asked Questions
What is the practical difference between species richness and species evenness, and why do these worksheets treat them separately?
Species richness is simply the count of different species present in a given area. Evenness describes how the individual organisms are distributed across those species. A habitat with ten species where one dominates 90 percent of the population has the same richness as a habitat where all ten species appear in roughly equal numbers — but the two sites are ecologically very different. Because students reliably conflate these metrics until they are forced to calculate and compare them side by side, the worksheets address each measure in its own task before asking students to synthesize both in a written conclusion.
Can these worksheets be used without a textbook?
Each worksheet includes enough context through embedded prompts, definitions, and data tables to function independently. The HIPPCO case studies and ecosystem services tasks supply sufficient information within the worksheet itself so students do not need a chapter open alongside them. The genetic diversity worksheets benefit from a brief classroom explanation of allele frequency before students begin, but the activities build directly from the data provided rather than from assumed background reading.
How much class time should I budget for each worksheet?
The vocabulary and concept-mapping worksheets run 15 to 20 minutes for most 9th graders. Data analysis worksheets — particularly the species richness calculations and the biomagnification tracing task — take closer to 25 to 35 minutes. Conservation policy evaluations, which ask students to construct a written, evidence-based argument, should be budgeted at 35 to 40 minutes. These estimates come from classroom use; students' familiarity with scientific argumentation will affect pacing in either direction.
Are these appropriate for an honors biology section without changes?
The biodiversity worksheets pdf for 9th grade that focus on data analysis and conservation policy evaluation are well-suited for honors sections as written. The vocabulary and concept-mapping worksheets are most useful in that context as preview tools or quick review checks rather than as primary instructional activities. For an honors cohort, move through the foundational worksheets quickly and allocate the majority of class time to the HIPPCO analysis tasks and the ecosystem services performance tasks, where the reasoning demands match the pace honors students need.
Clear All