6th Grade Graphing Inequalities on a Number Line PDF Worksheets
These 6th grade graphing inequalities on a number line pdf worksheets give teachers a focused set of printable resources for one of the conceptually sharpest pivots in early algebra: convincing students that an inequality doesn't produce a single answer but rather a continuous stretch of values. The set moves from foundational circle-and-shade mechanics to matching tasks, reverse-engineering problems, and word-problem translation. Teachers who need something ready for Monday morning warm-ups or a Friday review block will find these worksheets drop into the lesson without rearranging anything.
What Each Worksheet Targets
Every graph on these worksheets requires two decisions: what kind of circle to place at the boundary value, and which direction to shade. Open circles mark a value excluded from the solution set — used when the inequality is strictly less than or greater than. Closed circles mark an included boundary — used with less than or equal to and greater than or equal to. Both rules look manageable in isolation. The difficulty is that students must apply them simultaneously, sometimes when the variable sits on the right side of the expression, which reverses the intuitive reading.
The exercise types across the set include:
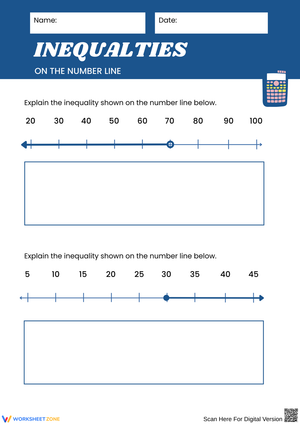
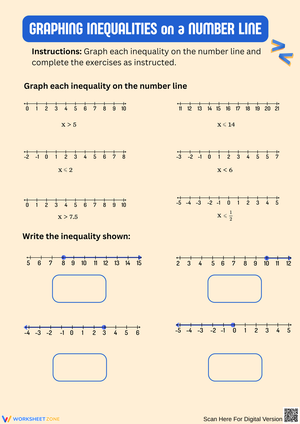
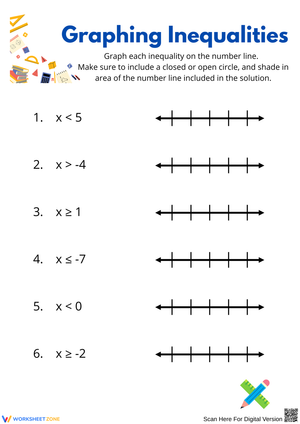
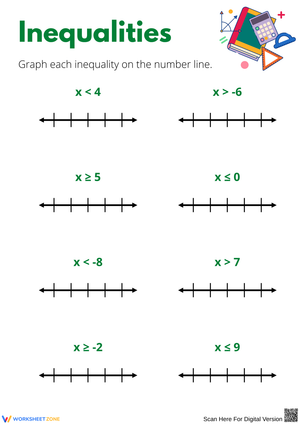
- Graphing from a statement: Students draw the correct circle and shade the number line with no pre-built graph to reference.
- Matching: A pre-drawn graph is paired with a list of inequalities; students select the correct match. This builds visual recognition before students have to produce graphs themselves.
- Writing the inequality from a graph: Given a completed number line, students write the algebraic statement it represents — they must read the circle type, the shading direction, and commit to a symbol. Harder than it looks.
- Word problem translation: Students read phrases like "a minimum of seven" or "fewer than twelve" and convert them into both an algebraic inequality and a graph. This format consistently exposes vocabulary gaps that pure symbol work doesn't surface.
Student Errors Worth Anticipating Before You Hand This Out
The most persistent mistake is the "symbol points the way" shortcut. Students learn early that shading goes in the direction the inequality symbol points — and that holds when the variable is on the left. The moment the variable appears on the right, the shortcut inverts. A student looking at "5 is less than x" will shade left because the symbol points left, missing entirely that x must be greater than five. This isn't just a procedural slip; it reflects a real gap in how students read an inequality as a relationship rather than a directional cue.
Open and closed circle confusion tends to surface inconsistently. A student who correctly closes the circle for "greater than or equal to" on Monday will open it for the same symbol on Wednesday. What helps more than re-explaining the rule is having students read the inequality aloud and then ask themselves one concrete question: "Is the boundary number itself a solution?" If yes, the circle fills in. A third error — easy to miss because it doesn't affect the graph visually — is students believing only whole numbers satisfy the inequality. After graphing x greater than 3, they'll list 4, 5, 6 as the answer set. Asking "Is 3.7 a solution? What about 4.001?" tends to break that assumption quickly.
Standard Alignment
These worksheets address 6.EE.B.8, which calls on sixth graders to write inequalities comparing a variable to a constant — statements like "x is greater than c" — and to recognize that those inequalities have infinitely many solutions represented on number line diagrams. In classroom terms, 6.EE.B.8 sits at the back end of the expressions-and-equations unit, after students have already worked with one-step equations. The jump from "find the value of x" to "show every value x could be" is exactly where this standard lives, and where these worksheets do the heaviest instructional work.
Building These Worksheets Into Your Lesson Planning
The matching exercises work well as a whole-class launch during the first few days on this topic. Projecting one on the board and asking students to talk through the circle type and shading direction before writing anything creates a low-stakes entry point and surfaces confusion before students have committed an error to paper. The graphing and reverse-engineering worksheets are reliable independent practice for center rotations or seat work. When a handful of students are still struggling after the whole-class lesson, those worksheets give you something concrete to work through at a back table while the rest of the class works independently.
The 6th grade graphing inequalities on a number line pdf worksheets in this set are also well-suited to exit tickets — three or four problems at the end of class tell you exactly which students are still inverting the shading direction or defaulting to open circles regardless of the symbol. Word-problem translation worksheets are most useful right before a unit assessment, when students need practice moving between language and symbolic representation without a memorized procedure to lean on.
Adjusting the Set for Mixed-Ability Classes
For students who are still building confidence with the symbol-to-graph connection, the matching format removes production pressure. Instead of constructing a graph from scratch, they're choosing between options — which still requires analyzing circle types and shading direction but lowers the cognitive load of starting with a blank number line. A reference card showing a closed circle next to the less than or equal to symbol gives these students a concrete anchor rather than a rule to retrieve from memory under pressure.
Students who have the mechanics down can move to the word-problem translation worksheets and the reverse-engineering tasks. A useful extension is to take the 6th grade graphing inequalities on a number line pdf worksheets and ask these students to write their own word problems that produce a specific given graph — this requires working backward through the full translation chain and generates some genuinely interesting writing. For students working above grade level, introduce inequalities that require a one-step operation before graphing, such as "x plus two is greater than seven." The graphing format stays identical while the equation-solving step adds real challenge.
Frequently Asked Questions
How do I help students remember open versus closed circles without just repeating the rule?
Have students read the inequality aloud and ask one question: "Is the boundary number itself a solution?" If yes, the circle fills in; if no, it stays open. This takes longer than a mnemonic, but it forces students to reason through the decision — which matters when the variable is on the right side or when symbols vary across problems.
What should I do when students shade in the correct direction but place the wrong circle?
That error pattern means students have internalized the direction rule but are still fuzzy on the symbol-to-circle connection. Work through just the circle decision on five problems in a row in a small group and ignore the shading entirely. Isolating the sub-skill usually moves faster than reteaching the whole procedure at once.
The variable-on-the-right problem keeps coming up. What actually helps?
Teach students to rewrite the inequality so the variable is on the left before graphing. "5 is less than x" becomes "x is greater than 5." This takes about ten seconds and eliminates the directional confusion entirely. It also reinforces the habit of rearranging expressions into a readable form, which pays dividends later in the unit when inequalities get more complex.
Are these worksheets better suited to practice or to formal assessment?
The 6th grade graphing inequalities on a number line pdf worksheets in this set work best as formative tools — warm-ups, exit tickets, and targeted reteaching sessions. For summative assessment, you'll want to pair the graphing skill with a written explanation of what the shaded region represents, and that requires a different format than these worksheets provide.
Clear All