Line Graph Printables That Make 5th Grade Data Practice Easier
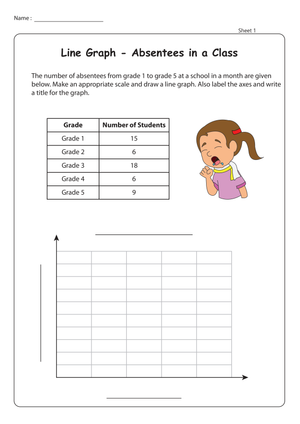
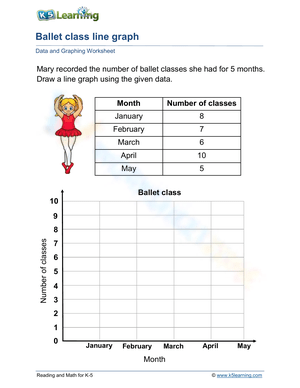
These line graph printable worksheets for 5th grade move students past labeling graph parts and into the harder work of interpretation — reading a scale with non-standard intervals, calculating exact changes between time points, and writing an explanation that actually uses the data. Each worksheet centers on a single scenario: a week of temperature recordings, a six-week reading log, plant growth tracked in centimeters over several months. That narrow scope is intentional. One clear graph with four or five targeted questions reveals more about what a student understands than a longer task built around loosely connected items.
The Thinking Each Worksheet Demands
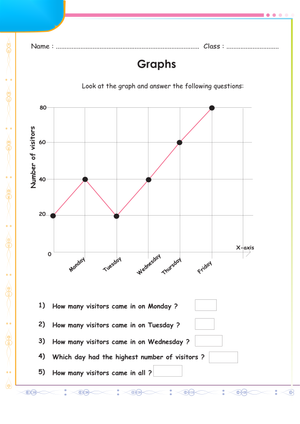
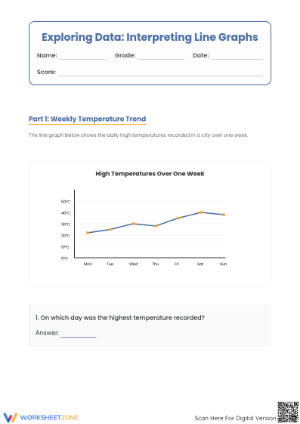
Fifth graders are developmentally ready to move from "what does this graph show" to "what does this graph mean," and that shift is where these resources do their work. Students read the graph title and identify what is being measured. They study the axes to determine the unit and the scale intervals. They locate exact values at specific time points, compare two points, and calculate the numerical difference. Then they describe the overall trend — not just "it went up" but "the temperature rose by 8 degrees between Monday and Wednesday, then dropped sharply over the weekend." The final question on most worksheets asks students to use evidence from the graph to support a claim, which is the skill that connects most directly to data work they will encounter in science and social studies.
Where Student Work Goes Wrong — And What to Watch For
The most consistent error pattern is not misreading the trend; it is misreading the scale. A student who encounters a scale marked in intervals of 5 will sometimes treat every tick mark as worth 1. The result is a plausible-looking answer — the student did look at the graph — but one that is off by a factor of 5. These worksheets make that error visible because they sequence exact-value questions before comparison questions. When a student calculates a difference incorrectly, you can check the individual values first and determine whether the problem is scale access or subtraction.
A second pattern worth noting: students who read values correctly often struggle to write a trend statement without some language support. They know the line went up, but they write "it got more." Pushing students toward words like increased, decreased, remained steady, and dropped sharply is a vocabulary task as much as a math task. Worksheets that include bolded comparison vocabulary on the page reduce that confusion without removing the interpretive work.
Building These Worksheets Into Your Lesson Plans
The most efficient use is as a warm-up at the start of a data unit: three to five minutes, one graph, two questions — one exact-value item and one comparison. That routine builds graph-reading fluency before students encounter multi-step tasks. Later in the unit, the same format works for independent practice after direct instruction on intervals and trend language, and again as an exit-ticket check before a formal assessment.
Line graph printable worksheets for 5th grade also slot cleanly into math centers. If you run stations during a data unit, a station built around one or two graphing worksheets gives students structured, independent practice while you pull a small group. The format is familiar enough that students work without repeated directions — which matters in a center context where you are not available to re-explain the task every few minutes.
Data Contexts That Work at This Grade Level
Graphs built around familiar situations — rainfall tracked across a school week, savings logged toward a goal, minutes of exercise recorded across a month — give students something to reason against. When the data reflects something recognizable, students catch their own scale errors: if a graph about plant growth shows the plant shrinking by 20 centimeters in one week, a student thinking about what the data represents will flag that before moving on. That self-monitoring rarely happens when the context is abstract or when the situation behind the numbers is never explained.
There is also a cognitive load benefit. Familiar contexts reduce the amount of reading students have to process before they can begin the math. A student who understands that the graph records average weekly rainfall in November can go straight to the scale — the setup is already in working memory. That efficiency matters especially for students who hit overload when a task front-loads too much unfamiliar text before the first question.
Adjusting These Worksheets for Different Student Levels
For students still working on basic scale reading, the most useful adjustment is to add reference marks directly to the graph — a light horizontal line at the value they need to find, or a verbal prompt in the question directing attention to the axis label. That kind of support removes the access barrier without changing the math goal. Students who need it are often fully capable of the reasoning work once the scale confusion is resolved.
Line graph printable worksheets for 5th grade are straightforward to extend for students who have already mastered value reading and trend description. Add a follow-up question: "Based on the pattern in this graph, predict what the value might be in the next time period and explain your reasoning." That step requires students to project beyond the plotted data using the trend they identified — genuine extension, not just more of the same. A second option is to give students a data table and ask them to plot the graph themselves before answering any interpretation questions.
Frequently Asked Questions
What should fifth graders already know before working with these graph activities?
Students should be able to read a two-axis graph, understand that the x-axis typically represents time and the y-axis represents a measured quantity, and work comfortably with a scale that increases by a consistent interval. If skip-counting by 2, 5, or 10 is not yet secure, scale reading will slow them down on any of the interpretation tasks.
Can these worksheets serve as a formative assessment tool?
Yes. Each worksheet with a mix of value-retrieval, comparison, and trend-explanation questions functions well as a short formative check. The written explanation questions in particular give you a view into student reasoning that a multiple-choice format cannot match — you can see whether the student used the graph labels correctly, whether the comparison is grounded in actual values, and whether the explanation would make sense to someone who had not seen the graph.
How many worksheets are typically useful across a data unit?
Most five-day data units draw on line graph printable worksheets for 5th grade at three or four points: one early to establish a baseline, one or two during practice, and one at the end for review or informal assessment. That spacing builds retrieval across the unit rather than concentrating all graphing work into a single session.
Clear All