These 11th grade half life graphing worksheets give chemistry and physical science teachers a structured way to move students past rote calculation and into genuine graph literacy — building decay tables, transferring values to a coordinate plane, and explaining what each plotted point means in the context of radioactive decay. The set covers the full graphing sequence from initial amount to smooth exponential curve, with interpretation questions that make misconceptions visible before they reach a test.
What's Inside the Set
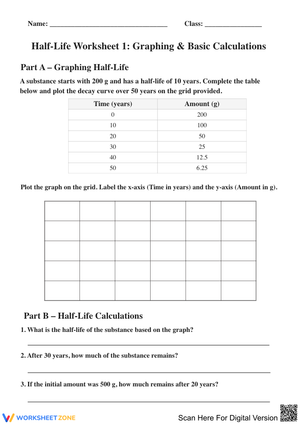
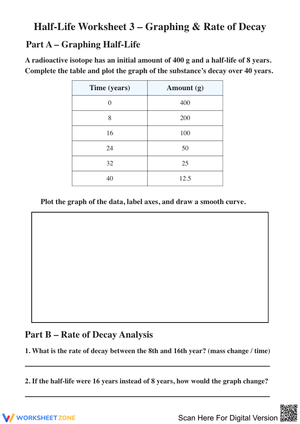
Each worksheet targets a specific layer of the graphing process rather than asking students to do everything at once. The early worksheets center on data tables: given a starting mass and a half-life value, students calculate the remaining amount after each interval, working through the repeated halving until the pattern becomes automatic. Later worksheets shift to graphing — students transfer those table values to a labeled coordinate plane, with time on the x-axis and remaining quantity on the y-axis, then connect the points into a smooth decay curve. The final worksheets in the set are interpretation-heavy: students read an unfamiliar graph and must identify the starting amount, the half-life interval, and how much of the sample remains at a specified time.
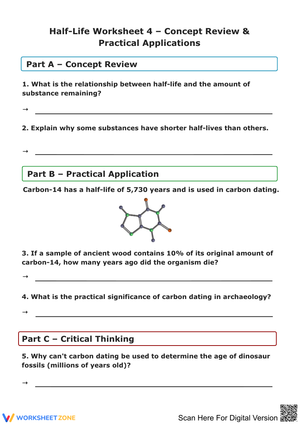
Applied science contexts — carbon dating timescales, medical isotopes like iodine-131 used in thyroid treatment, and uranium decay in geological samples — appear in the word-problem worksheets toward the end. Those prompts raise the cognitive demand because students must extract graph-relevant numbers from a paragraph before they can plot anything.
Standard Alignment
These worksheets align with NGSS HS-PS1-8, which asks students to develop models to illustrate the changes in the composition of the nucleus during radioactive decay and the accompanying release of energy. Graphing the exponential decay curve directly supports the modeling expectation — students are not just calculating; they are constructing and interpreting a visual representation of a nuclear process. The interpretation questions also connect to the crosscutting concept of Patterns, specifically recognizing that mathematical regularities (repeated halving over equal time intervals) can be used to explain and predict natural phenomena. For teachers in states using NGSS-aligned standards, this maps cleanly into the nuclear chemistry unit typically taught in 11th grade chemistry.
Mistakes Students Make That These Worksheets Help You Catch
The most persistent error isn't computation — it's confusing elapsed time with the number of half-lives completed. A student given a half-life of 5,730 years will often label "11,460 years" as the first half-life mark rather than the second, because 11,460 feels like "the big number." That confusion shows up immediately on the graph as an incorrectly scaled x-axis, and every point after it is off.
A second error pattern: students subtract a constant amount each interval rather than dividing. If a sample starts at 80 grams and loses 40 grams in the first half-life, many students will subtract 40 again in the second interval, arriving at 0 rather than 20. On a graph, this produces a straight downward line — and some students will defend that line because it looks neat. The worksheets include a curve-shape question specifically designed to surface this misunderstanding: students are asked whether their graph is linear or curved and must explain why using the word "halving."
A third recurring issue is point connection. Students who connect plotted points with straight segments between each pair end up with a zigzag approximation of the curve. This looks like a graphing-skill problem, but it usually reflects a deeper gap — those students have not yet internalized that decay is continuous, not stepwise. The interpretation questions address this directly by asking what the graph predicts at a time that falls between two plotted points.
Lesson-Planning Ideas
The most effective placement is mid-unit, after students have been introduced to the half-life formula but before formal assessment. At that stage, students can calculate but often cannot explain — and these worksheets force the explanation.
A practical opening move: before distributing a worksheet, ask students to place a small mark or tick above each x-axis division as they label it, identifying that tick as "one half-life completed." That annotation step, which takes about ninety seconds, keeps the number-of-half-lives count visually separated from elapsed time and prevents the labeling errors described above. It costs nothing in class time and eliminates a significant source of cascading graphing mistakes.
The shorter worksheets — those with one graph and three to four interpretation questions — work well as Monday warm-ups during the two weeks following the initial half-life lesson. Spaced retrieval matters here: students who encounter the graphing task again after a few days of working on other chemistry content retain the decay curve concept more reliably than students who only practice it in a concentrated block. A Friday review worksheet near the end of the unit, when students are comparing isotopes with different half-lives side by side, surfaces any gaps before the unit exam without requiring a full class period.
Adjusting the Worksheets for a Range of Learners
Students who struggle with the graphing mechanics benefit from worksheets where the axes are pre-labeled and the scale is already set. Providing the first plotted point gives those students a reference for both direction and scale, which removes one major source of early frustration. Partially completed tables — where every other row is filled in — allow students to check their halving logic without doing all the arithmetic independently.
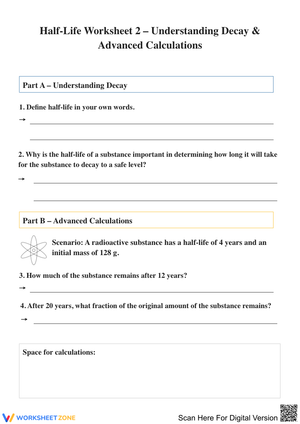
Students who are ready for more can work with nonfriendly starting values (think 150 grams rather than 128), which don't produce clean whole-number remainders and require students to carry decimal values through the table and onto the graph. A comparison worksheet — two isotopes with different half-lives plotted on the same axes — pushes further by asking students to explain why one curve drops more steeply than the other and what that means for the practical use of each isotope. That question has no formula answer; it requires reading the graph as a scientific argument.
Frequently Asked Questions
How many worksheets are in the set, and can I assign them separately?
Each worksheet in the set is a standalone file. You can assign the table-focused worksheets independently of the graphing worksheets, or sequence them across several class periods. There's no required order, though the scaffolded versions are labeled so it's clear which ones are appropriate earlier in the unit.
Are these appropriate for physical science as well as chemistry?
Yes. The graphing and interpretation skills are the same regardless of course label. Physical science teachers working through a radioactivity unit typically use the earlier worksheets in the set; AP Chemistry teachers have used the comparison and word-problem worksheets as enrichment or pre-assessment material.
What prior knowledge do students need before using these worksheets?
Students should be able to plot ordered pairs on a coordinate plane and should have had at least an introductory lesson on what a half-life represents conceptually — the time required for half a radioactive sample to decay. The worksheets do not require prior experience with the half-life formula, though students who have seen it will move through the table sections faster.