11th Grade Parabola Transformations Worksheets Printable
These 11th grade parabola transformations worksheets give teachers a structured, printable path through one of the most concept-dense units in high school algebra — the relationship between vertex form and what a parabola actually does on a coordinate grid. Each worksheet targets a specific layer of that relationship, so students build from single shifts to combined transformations without losing the thread between symbolic and visual representations.
The Specific Skills Targeted
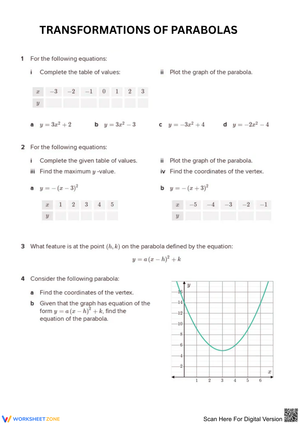
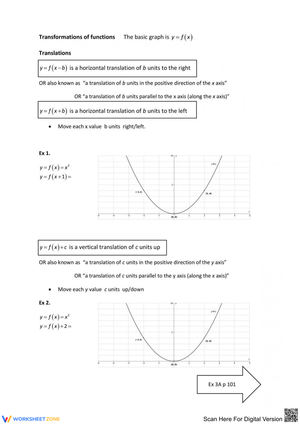
The set moves through vertex form, y = a(x - h)² + k, systematically. Early worksheets isolate horizontal and vertical translation so students see each variable's effect before the two appear together. Later worksheets add reflection over the x-axis, then vertical stretch and compression, and finally mixed problems that require students to hold all four transformation types simultaneously. The progression matches the instructional sequence in OpenStax Algebra and Trigonometry 2e and reflects the standard classroom ordering teachers use in Algebra 2 and Pre-Calculus courses.
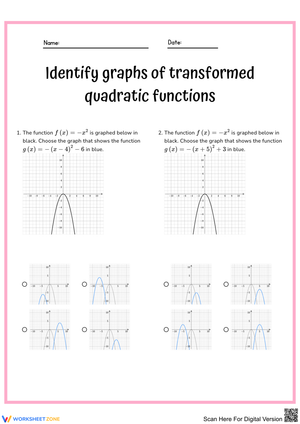
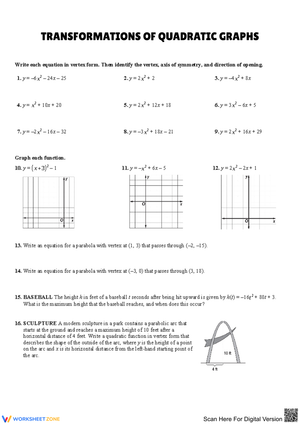
Within that arc, students practice several distinct task types: graphing a parabola from a given equation, writing an equation from a graph, identifying specific transformation details from an unlabeled curve, and explaining in writing why a shift moves in a particular direction. That last task type — the written explanation — separates these worksheets from purely computational practice. When students have to say why the vertex of y = (x - 4)² + 1 sits at (4, 1) and not (-4, 1), the underlying reasoning becomes visible rather than buried under a correct-looking graph.
Standard Alignment
These worksheets address CCSS HSF-BF.B.3, which calls for students to identify the effect of replacing f(x) with f(x) + k, kf(x), f(kx), and f(x + k) for specific values of k. In classroom terms, that standard lands in Grade 11 because it requires students to read transformation effects from algebraic structure, not just from a table of values — a level of abstraction that typically emerges after students have had foundational exposure to function notation in Grade 9 and 10. The worksheets also support CCSS HSF-IF.C.7a, which addresses graphing quadratic functions and identifying key features including vertex and axis of symmetry.
Mistakes Students Make That These Worksheets Help You Catch
The horizontal shift sign error is the most persistent problem at this level, and it is worth understanding why it survives even careful instruction. When students see y = (x - 3)², they read the minus sign and move the vertex left. This is not carelessness — it reflects a reasonable but incorrect generalization from other algebraic contexts where subtraction moves you in a negative direction. The worksheets build in deliberate comparison problems: students graph y = (x - 3)² and y = (x + 3)² side by side on the same grid, then write a sentence identifying which moved which direction. That forced comparison is more effective than another worked example from the front of the room.
A second error pattern involves the coefficient a. Students frequently process a negative a as only a width change — they know something is different, they adjust the shape, but the parabola still opens upward. The issue is that they have learned to look at |a| for width and have mentally disconnected the sign from the opening direction. Error-analysis problems on the worksheets show a student's incorrect work and ask the class to locate the mistake, which surfaces this misconception in a low-stakes way before it shows up on a test.
Why This Format Supports the Underlying Cognitive Work
Parabola transformations require students to hold three things in mind at once: the equation's symbolic structure, the graph's visual shape, and the verbal description of what changed. Research on cognitive load suggests that when students are constructing meaning across multiple representations, having a stable, annotatable artifact — something they can circle, label, and mark up — reduces the mental overhead of switching between representations. A printed grid with enough space to plot the parent function in one color and the transformed parabola in another gives students a concrete record they can refer back to while working on the equation side of the same problem.
This is also why graph size matters more than teachers sometimes expect. When the coordinate grid is cramped, a parabola with a = 2 and a parabola with a = 0.5 can look nearly identical at the scale most students sketch. Worksheets that provide a full-size grid for each problem make it possible for students to actually see the width difference — which is the whole pedagogical point of that section of the unit.
Building These Worksheets Into Your Lesson Plans
The most consistent use pattern for this set is three-phase: a short focused worksheet at the start of class to reactivate the previous lesson's skill, direct instruction introducing the new transformation type, and then the corresponding worksheet as immediate practice before the concept drifts. That loop — activate, teach, apply — works particularly well for this unit because each transformation type genuinely depends on the previous one. Students who have not solidified shifts will compound that confusion once reflections and stretches enter the picture.
Two other placements worth noting: the error-analysis worksheets translate naturally into a whole-class discussion before a quiz, and the mixed-transformation worksheets work well as a station activity where student pairs talk through each problem before writing anything down. The pairing matters because students who have memorized a procedure often cannot explain it until someone asks them to — and the explanation is where the gaps appear.
Adjusting the Worksheets for a Range of Learners
The most practical differentiation strategy for this set is printing two versions of the graphing worksheets: one with a light reference sketch of the parent function y = x² already placed on each grid, and one with blank grids only. Students who need support can measure every transformation against the parent they can see. Students ready for independence work without that anchor. The mathematical target is identical in both versions — only the scaffolding differs — which keeps the class working on the same concept and makes it easier to bring both groups into the same debrief discussion.
For students who are moving faster, the most demanding extension is not adding more problems but changing the task type: give them a graph with no equation attached and ask them to write vertex form, standard form, and a transformation description in words. That triangulation across three representations requires a level of flexibility that goes beyond what a standard graphing problem asks for. For students who are still building basic fluency, reducing each worksheet to the three or four problems that isolate the core skill — and cutting the mixed items until those are solid — keeps the cognitive demand manageable without removing the grade-level content.
Frequently Asked Questions
Why do students keep reversing horizontal shifts even after direct instruction?
The sign inside the parentheses behaves opposite to every other algebraic context students have internalized — subtraction usually moves left, but in (x - h), it moves the vertex right. That conflict with prior learning makes this error unusually sticky. The most effective remedy is not re-explaining but forcing a side-by-side comparison: graph y = (x - 3)² and y = (x + 3)² on the same grid and ask students to describe what they see before they consult any notes. Seeing the discrepancy directly tends to override the verbal rule more reliably than hearing the rule repeated.
At what point in the unit should mixed-transformation problems appear?
Most teachers see better results waiting until students can identify each transformation type in isolation before combining them. A practical checkpoint: if students can correctly graph any single-transformation equation and write the equation for any single-transformation graph, they are ready for mixed problems. Introducing combined transformations before that point usually means students are guessing at the interaction rather than reasoning through it.
How do these worksheets fit into a class that uses graphing technology alongside paper practice?
Technology is well-suited for exploration — students can drag sliders and watch the parabola respond in real time. Paper practice is better suited for consolidation and assessment, because it requires students to commit to a choice without the option to adjust until it looks right. The most effective sequence uses digital tools during the introduction phase and printed worksheets once the concept needs to move from exploration into reliable, independent execution. These two formats are not competing; they address different moments in the learning cycle.
Clear All