These transformation of quadratic functions pdf worksheets for 11th grade give teachers ready-to-print practice that moves past rule recitation — students graph vertex form equations on coordinate grids, write equations from plotted parabolas, and describe every change from the parent function in their own words. The set builds from y = x² through single transformations and into combined changes, which is the sequence that actually makes the parameters legible rather than abstract.
What Students Practice in Each Worksheet
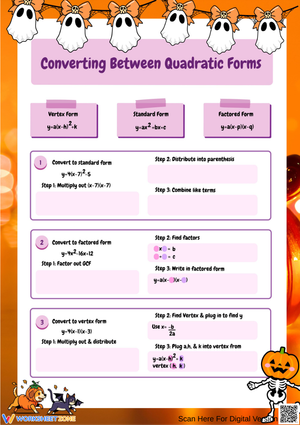
The central skill here is reading vertex form — y = a(x-h)² + k — with enough fluency to separate what h and k do from what a does. Those are genuinely different jobs, but they live in the same equation, and worksheets that blur them together produce students who can state a rule but can't reliably graph. Each worksheet in this set isolates or combines these roles in a way that keeps that distinction visible.
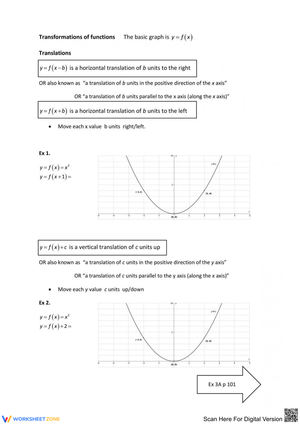
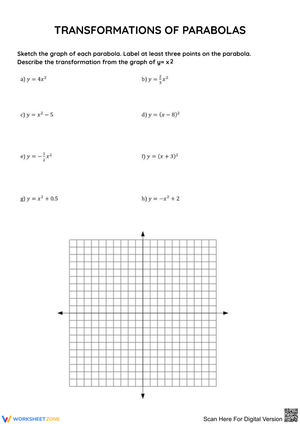
- Parent function foundation: locating the vertex at the origin, naming the axis of symmetry as x = 0, and establishing the width produced by a = 1 as the visual reference students carry through the rest of the unit
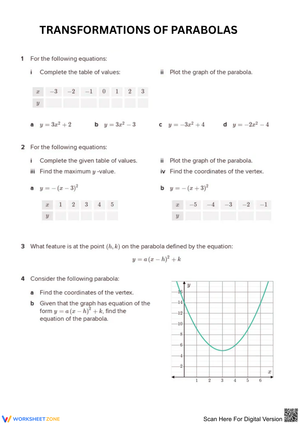
- Vertical and horizontal shifts: graphing functions where only k changes, then only h changes, with students labeling each new vertex and axis of symmetry before drawing the curve
- Reflections: identifying when a negative a flips the parabola and marking that change explicitly before touching the graph
- Stretches and compressions: comparing parabolas where |a| is greater than 1 against those where |a| is less than 1, with students describing the width change in words
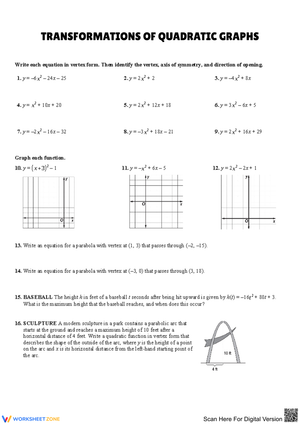
- Combined transformations: graphing functions with all three parameters active, then producing a written sentence describing every change from the parent function
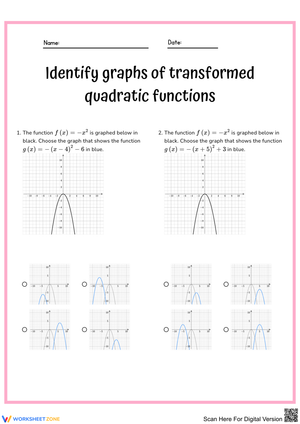
- Equation-writing from graphs: reading a plotted parabola and supplying the correct vertex form equation — including the sign and magnitude of a
Where Students Consistently Go Wrong — and What to Do About It
The most persistent error in this unit is the horizontal shift sign flip. A student who sees y = (x - 5)² will often graph a shift five units to the left — reading the minus sign directly as a movement direction rather than asking what x value makes the expression equal zero. Worksheets that insert that question explicitly before graphing begins — "what input makes (x - 5) equal zero?" — interrupt that automatic wrong move in a way that restating the rule does not.
A second pattern: students who see a = -2 will note the reflection and draw a parabola with the same width as the parent function. They processed the sign and ignored the magnitude, or vice versa. Worksheets that ask students to annotate a in two deliberate steps — first circle the sign, then name whether the magnitude makes the graph narrower or wider — surface this split before it becomes a full graphing error rather than after.
There is also a plotting habit worth watching. Many students correctly identify the vertex and then sketch the rest of the curve from memory rather than computing additional points. The result is a vertex in the right place attached to a curve with the wrong shape. Any worksheet that includes a values table alongside the coordinate grid forces students to anchor the curve in real coordinates instead of approximating it by eye.
Fitting These Worksheets Into Your Instructional Week
Early in the unit, the single-transformation worksheets work well as guided practice during direct instruction. Model one example at the board, then hand students the worksheet and give them the remaining fifteen minutes to work while you circulate. The printed coordinate grids keep students from fumbling with graphing technology during a skill-introduction lesson, which matters when the goal is building a stable mental picture of what each parameter does.
A small move that pays off during this phase: have students mark changes caused by h and k in one color and changes caused by a in a second color before drawing anything. That two-color routine forces students to treat position and shape as genuinely separate decisions, and it tends to reduce the sign errors that come from holding all three parameters in mind at once.
Mid-unit, the combined-transformation worksheets run well at stations — one group graphs from equations, a second matches equations to pre-drawn parabolas, and a third corrects worked examples that contain planted errors. The planted-error format is particularly useful here because it slows students down: instead of producing an answer, they have to identify the exact step where the work went wrong. That is a different cognitive task, and it tends to expose the misconceptions that standard graphing practice misses. The transformation of quadratic functions pdf worksheets for 11th grade that include answer keys are especially practical at this stage — teachers can sort exit tickets in two minutes and decide before the next morning whether a reteach is needed.
Adjusting the Set for a Mixed-Ability Class
For students who are still building comfort with vertex form notation, start with a worksheet that asks them to identify a, h, and k from the equation before any graphing begins, and pair it with a grid that has the parent parabola already drawn. Seeing the transformation as a comparison to something already on the page reduces the number of things students have to process simultaneously and makes the error patterns easier to isolate.
On-level students get the most from worksheets that rotate between three representations in the same session: graph the equation, write the equation from a different graph, then describe the transformation in one clear sentence. That rotation keeps practice from becoming purely mechanical — students can't just repeat the same move six times in a row.
For students moving ahead of the class, add a construction prompt at the bottom of a graphing worksheet: "Write a vertex form equation whose graph passes through (3, 7) and opens downward. Graph it. Describe every transformation from y = x²." This flips the task from executing a given procedure to designing a function that meets a set of constraints — a harder job that draws on all the same skills without introducing new content.
Standard Alignment
These transformation of quadratic functions pdf worksheets for 11th grade align with CCSS HSF-BF.B.3, which asks students to "identify the effect on the graph of replacing f(x) by f(x) + k, k f(x), f(kx), and f(x + k) for specific values of k." In an Algebra II or Pre-Calculus sequence, this standard typically surfaces during the quadratic functions unit — positioned before students encounter transformations of higher-degree polynomial or rational functions. The standard explicitly requires students to move in both directions: from equation to graph and from graph to equation, which is the two-way practice this set builds across multiple worksheets.
Frequently Asked Questions
Why do so many students shift the graph in the wrong direction when they see a positive value for h?
The issue is that students read the subtraction sign in (x - h) as a movement instruction rather than as part of an expression to evaluate. When they see (x - 3), they register "negative three, move left" without asking what input makes that expression equal zero. Building a short pre-graphing habit — write out "what value of x makes (x - h) = 0?" and let that answer become the x-coordinate of the vertex — corrects the error at its source rather than just repeating the rule.
Do these worksheets work for Algebra II students who already covered quadratics in 9th grade?
They work well for both first-exposure and second-pass learners, but the entry point differs. Students seeing vertex form for the first time need the single-transformation worksheets in sequence. Students in a second-pass Algebra II context often have the parent function solid but lose precision on combined transformations and equation-writing — for them, jump directly to worksheets that activate all three parameters at once and require written descriptions alongside graphs. The transformation of quadratic functions pdf worksheets for 11th grade that pair graphing tasks with equation-writing from pre-drawn parabolas are particularly useful for second-pass instruction because they reveal quickly where prior knowledge has gaps.
How many graphing problems is realistic for a single practice block?
Six to eight problems is a reasonable target for a twenty-minute practice window. Each graphing problem involves identifying the vertex, computing at least two or three additional points, drawing the curve, and labeling the axis of symmetry. More than eight problems in that window tends to produce rushed, careless graphs rather than careful ones. If a worksheet contains more than eight graphing items, split the use: first half for in-class guided practice, second half for homework or the following day's warm-up.
How can students use the answer key for genuine self-correction rather than just checking final answers?
Have students annotate directly on the worksheet before consulting the key: circle the vertex, write the axis of symmetry as an equation, and note whether the parabola opens up or down. Then compare to the answer key at that level of detail rather than comparing only the drawn curve. When a student knows the final graph is wrong and can also identify whether the vertex placement, opening direction, or curve width is the problem, the correction actually sticks. That specificity is what separates an answer key used for learning from one used for avoiding work.