


1 / 2
0
Views
0
Downloads
0.0
0
Save
0 Likes
Fun Thanksgiving Graphing Activities & Worksheets
0 Views
0 Downloads
Paste this activity's link or code into your existing LMS (Google Classroom, Canvas, Teams, Schoology, Moodle, etc.).
Students can open and work on the activity right away, with no student login required.
You'll still be able to track student progress and results from your teacher account.
Information
Description
What It Is:
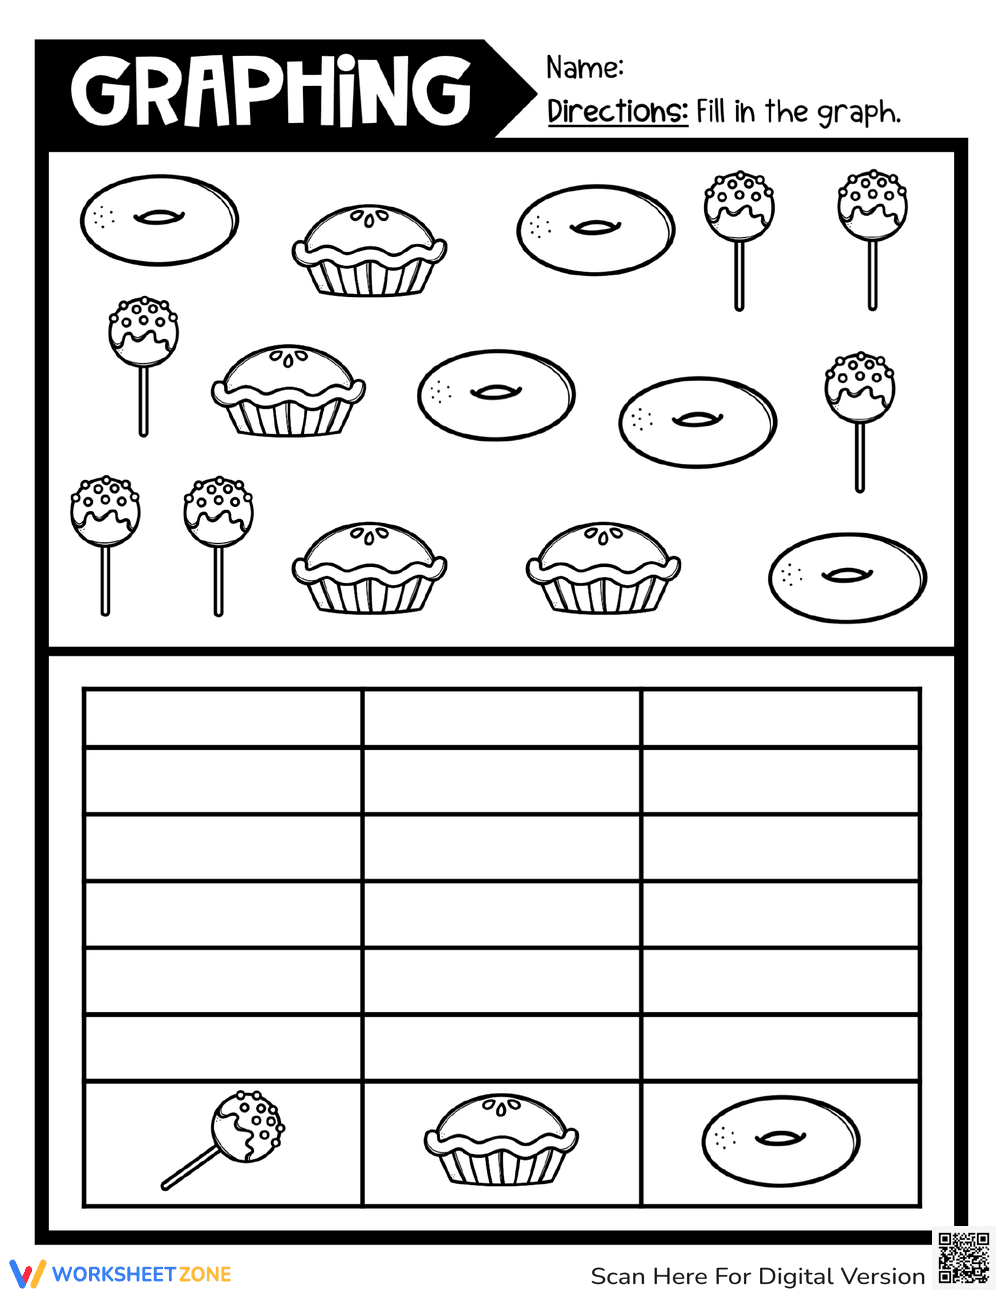
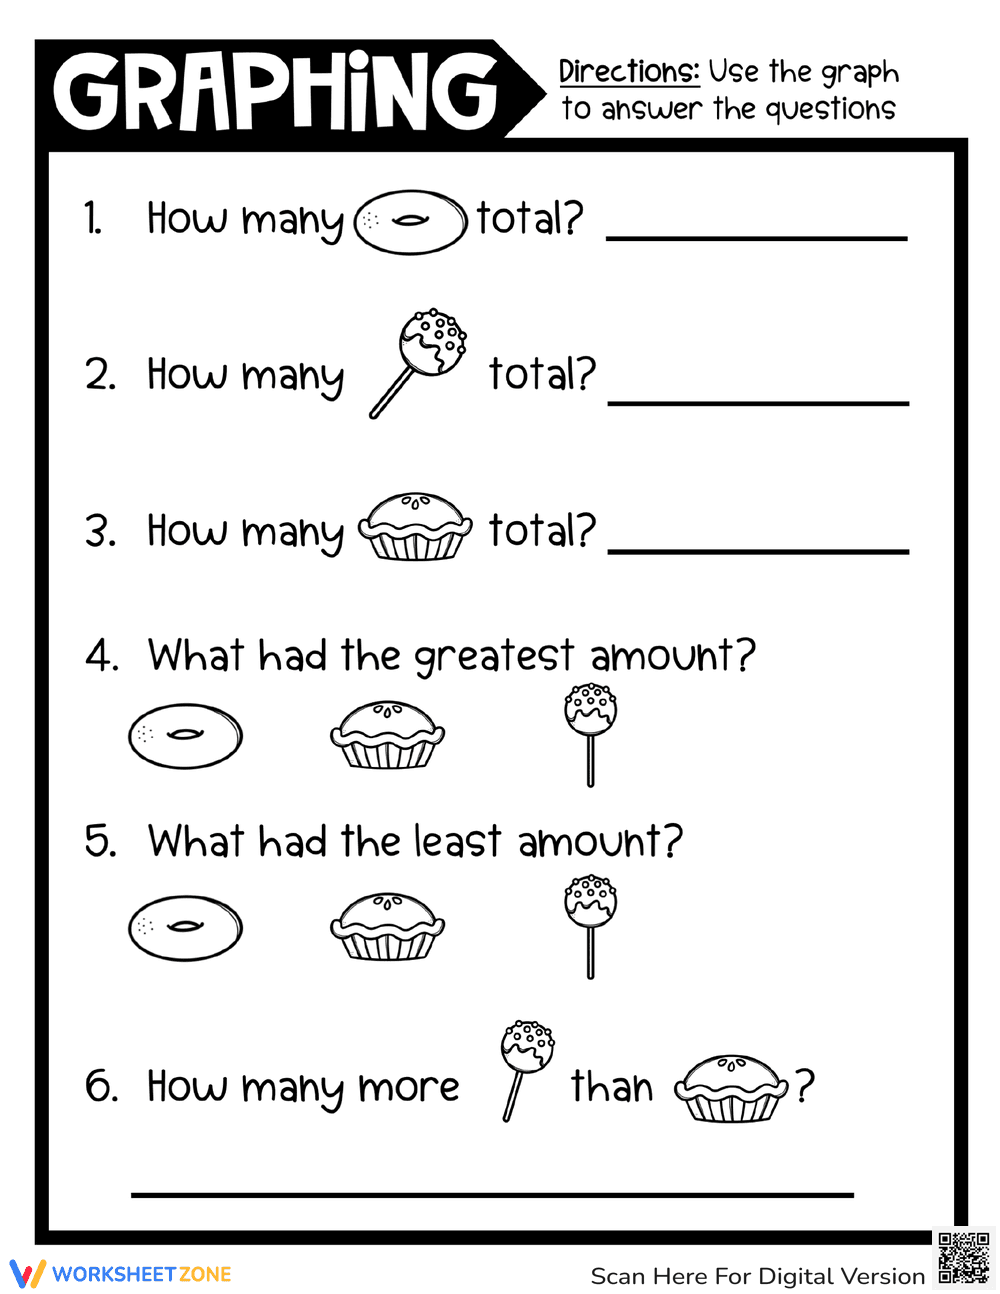
This is a graphing worksheet featuring illustrations of donuts, pies, and cake pops. Students are instructed to fill in the graph based on the quantity of each food item pictured above the graph. The graph has labeled sections for each food item.
Grade Level Suitability:
This worksheet is suitable for Kindergarten and 1st grade. The simple counting and graphing activities are appropriate for children learning basic data representation and analysis.
Why Use It:
This worksheet reinforces counting skills, data collection, and visual representation of data through graphing. It helps students understand how to organize information into a visual format and compare quantities.
How to Use It:
First, count the number of each food item (donuts, pies, and cake pops) in the image. Then, fill in the graph by coloring or marking the corresponding number of squares for each food item.
Target Users:
This worksheet is designed for young learners in Kindergarten and 1st grade who are learning about graphing and data representation. It is also suitable for homeschooling parents and teachers looking for engaging math activities.