


1 / 2
0
Views
0
Downloads
0.0
0
Save
0 Likes
Thanksgiving Graphing Activity: Fun Math Worksheet
0 Views
0 Downloads
Paste this activity's link or code into your existing LMS (Google Classroom, Canvas, Teams, Schoology, Moodle, etc.).
Students can open and work on the activity right away, with no student login required.
You'll still be able to track student progress and results from your teacher account.
Information
Description
What It Is:
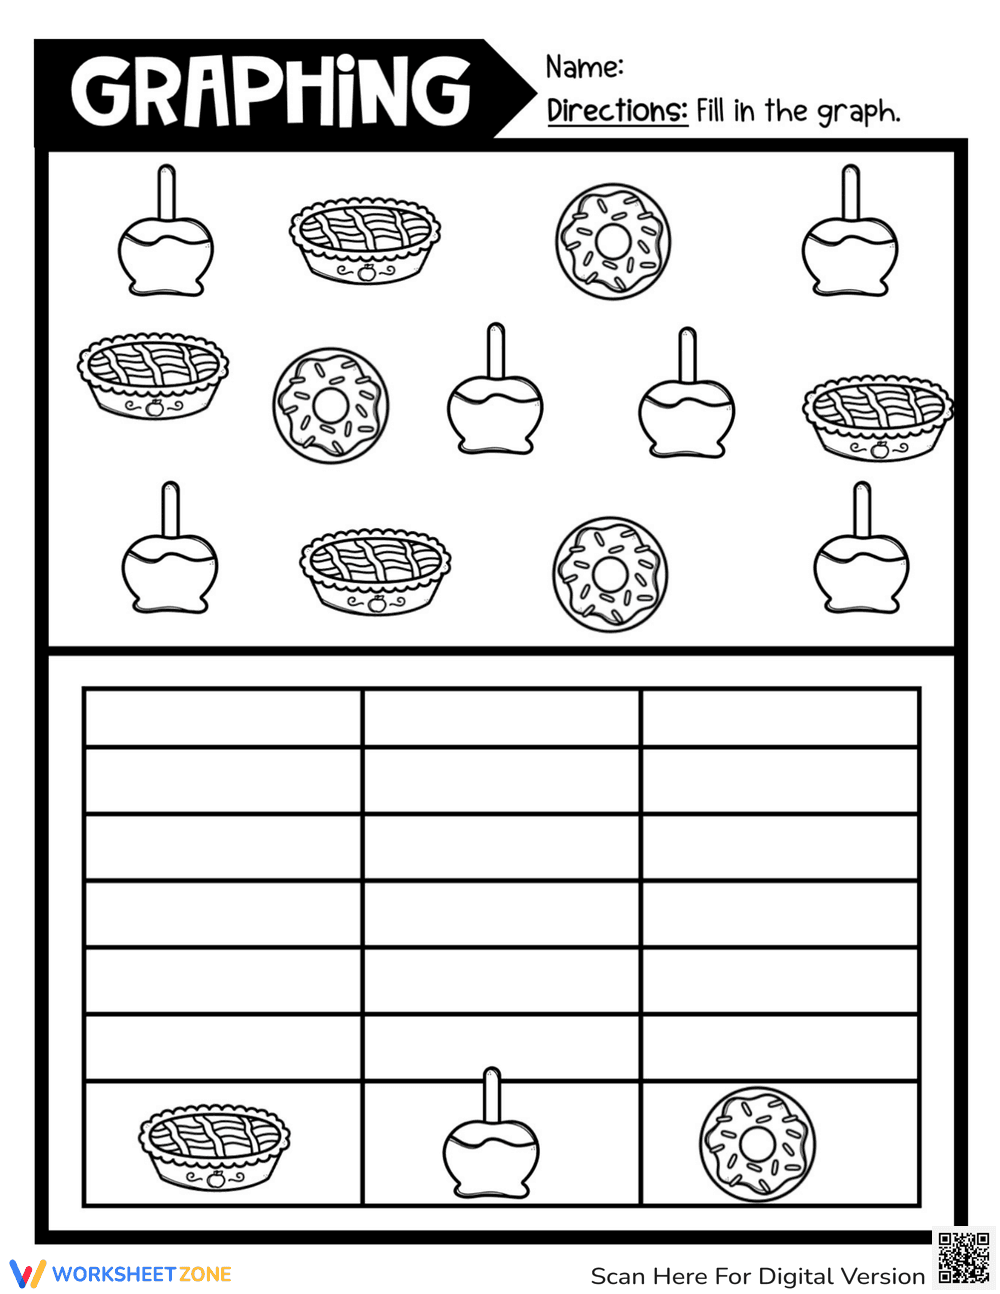
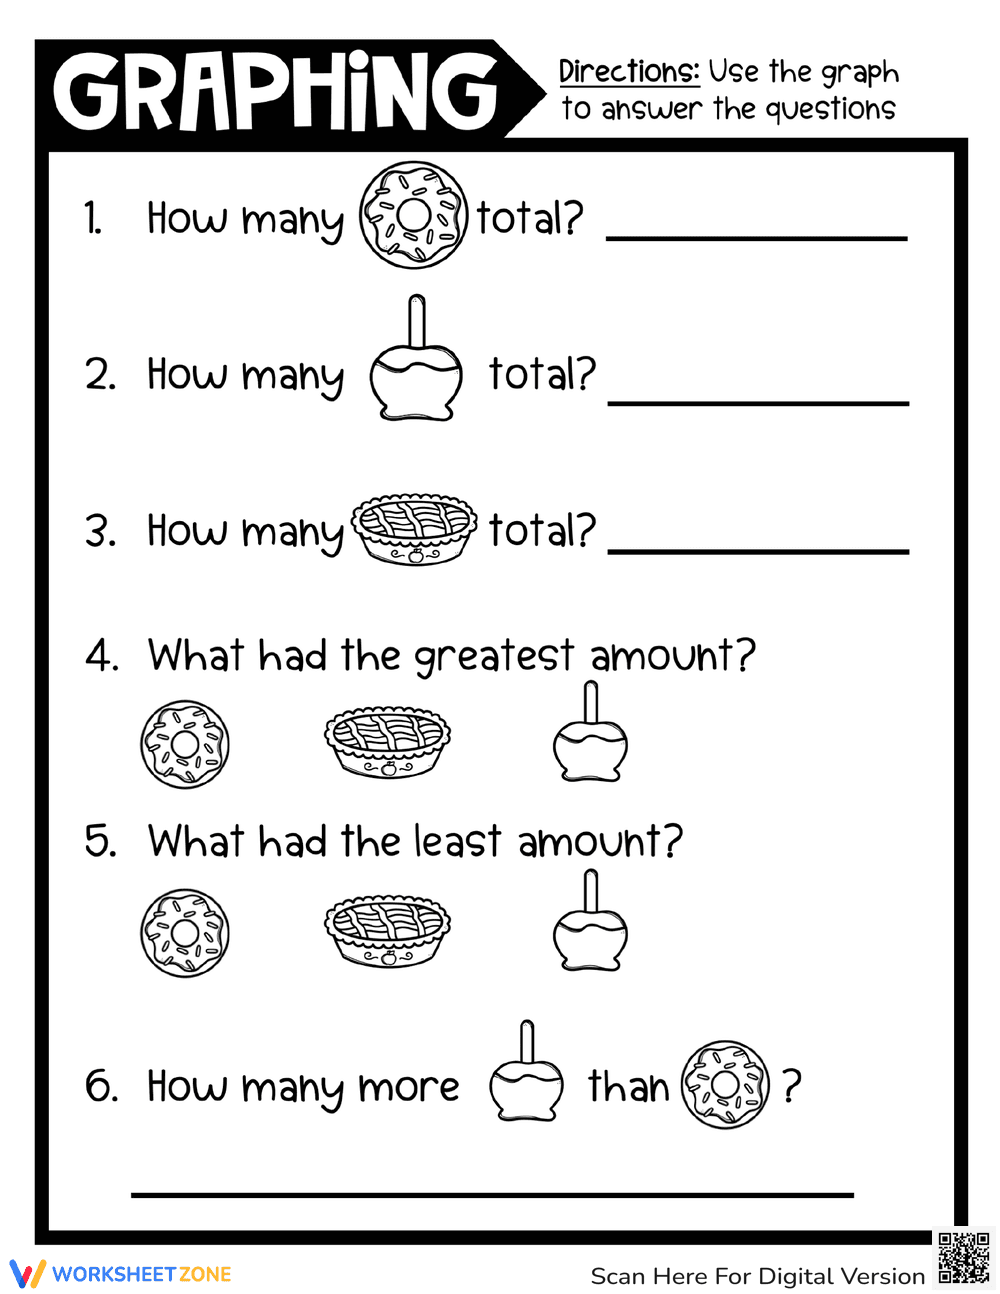
This is a graphing worksheet. It features images of different treats: caramel apples, pies, and donuts. Students are instructed to fill in the graph based on the quantity of each treat shown above. The graph has three columns corresponding to the three treats.
Grade Level Suitability:
This worksheet is suitable for Kindergarten and 1st grade. The simple counting and graphing activity is appropriate for students learning basic data representation.
Why Use It:
This worksheet helps students develop counting skills, data collection, and graphing skills. It reinforces one-to-one correspondence and provides a visual representation of data.
How to Use It:
Students count the number of each treat (caramel apples, pies, and donuts) in the image. Then, they fill in the corresponding number of squares in the graph for each treat's column.
Target Users:
This worksheet is designed for young learners in Kindergarten and 1st grade who are beginning to learn about graphing and data representation. It is also suitable for students who need extra practice with counting and visual discrimination.