


























Views
Downloads

Ready Homeostasis Time Series Worksheet | Grade 10 Biology
Paste this activity's link or code into your existing LMS (Google Classroom, Canvas, Teams, Schoology, Moodle, etc.).
Students can open and work on the activity right away, with no student login required.
You'll still be able to track student progress and results from your teacher account.
This Grade 10 biology worksheet guides students through interpreting variable-and-response time-series data in human feedback systems. High school learners analyze physiological responses, trace dynamic equilibrium, calculate response lags, and contrast effector actions in blood glucose regulation and thermoregulation to demonstrate mastery of negative feedback mechanisms.
At a Glance
- Grade: 10 · Subject: Biology
- Standard: Analyze time-series physiological data illustrating homeostatic negative feedback mechanisms
- Skill Focus: Interpret Variable-and-Response Time Series
- Format: 4 pages · 10 problems · Answer key included · PDF
- Best For: High school biology feedback loop analysis
- Time: 45–60 minutes
What's Inside
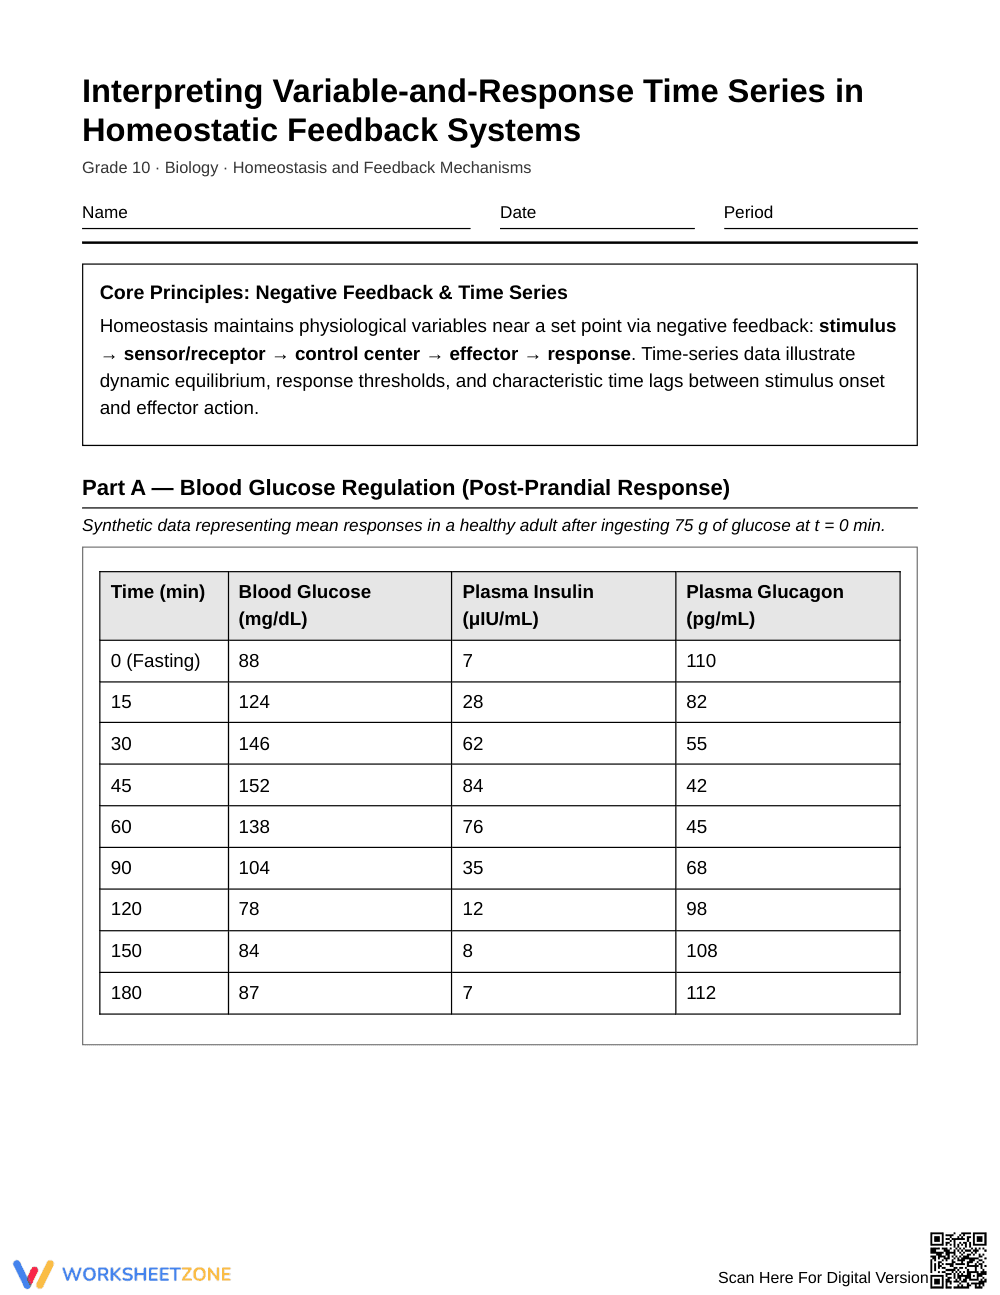
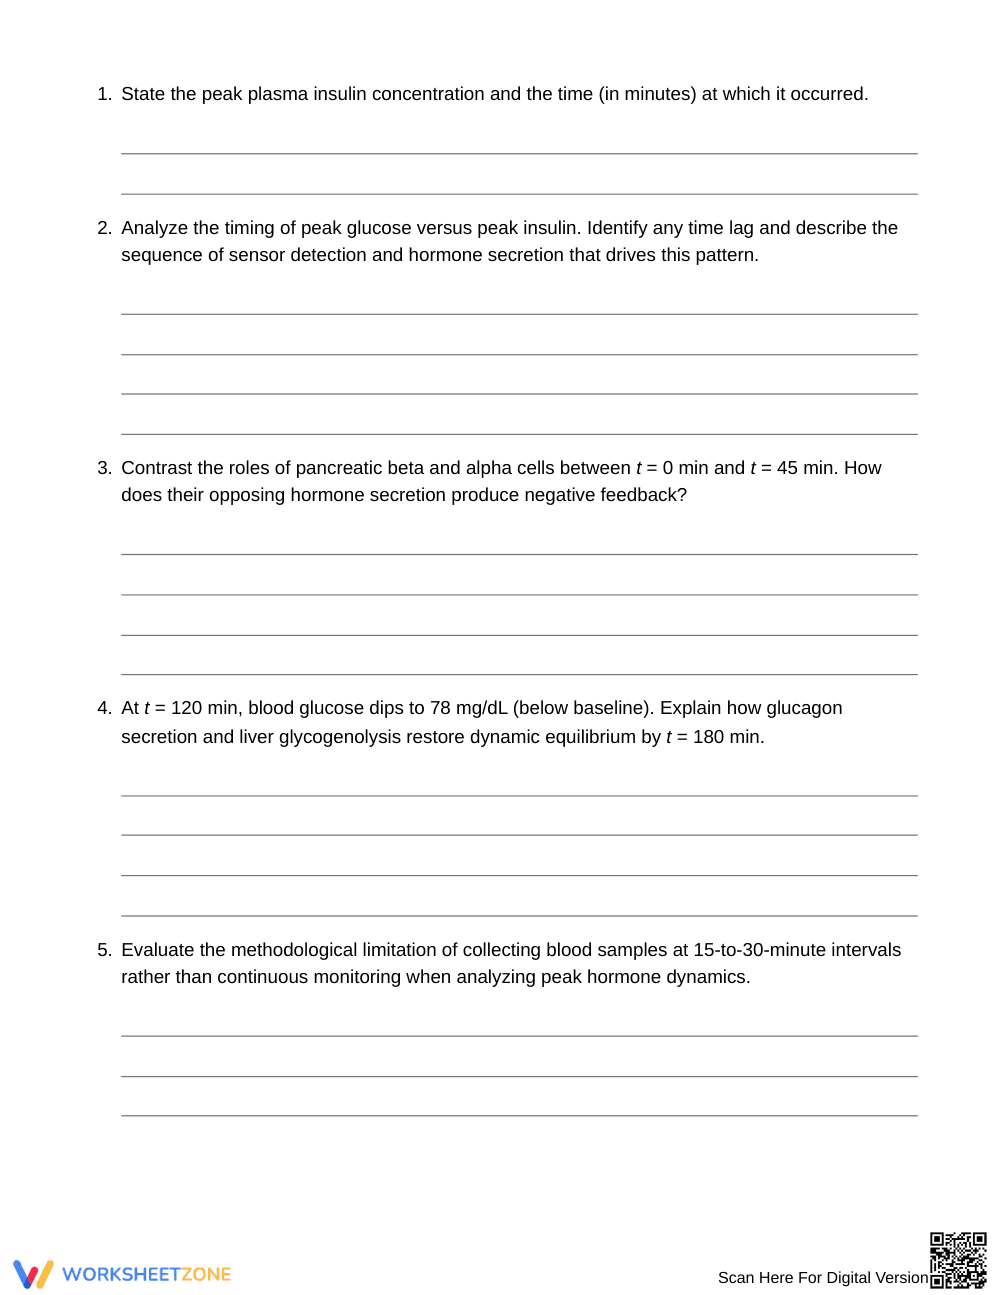
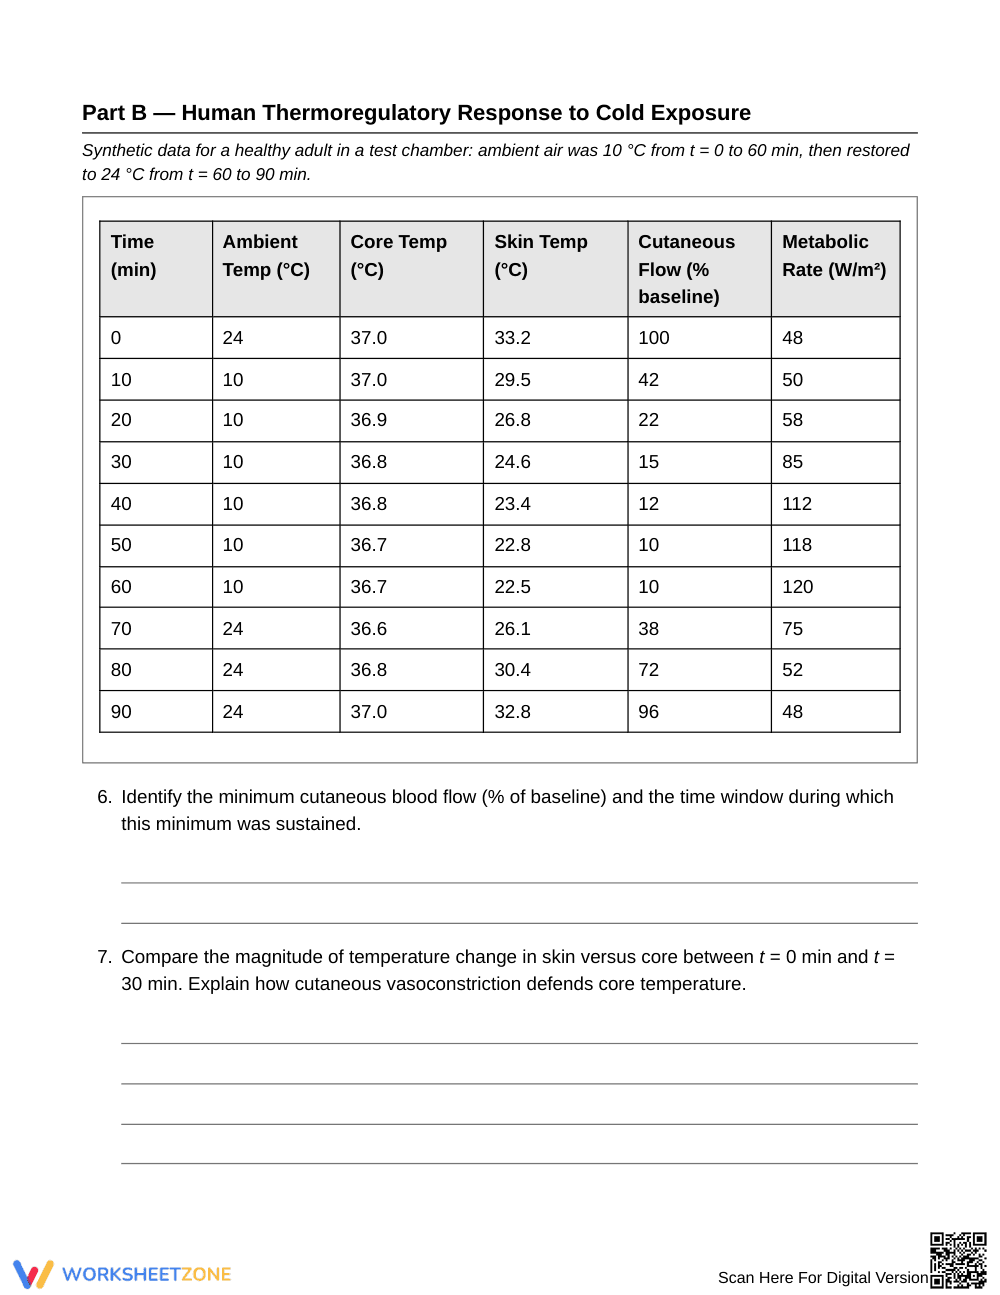
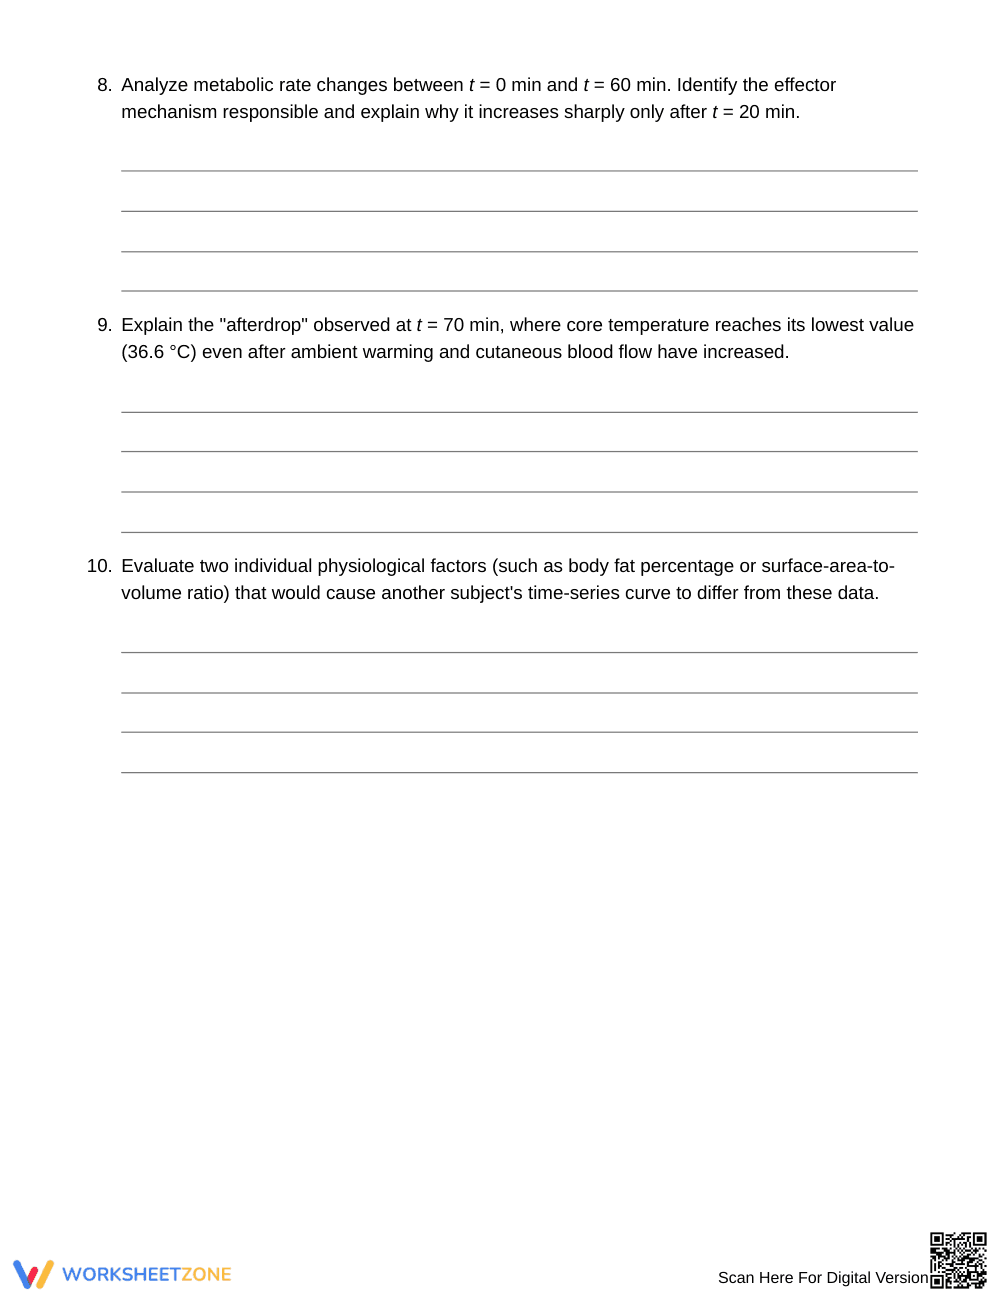
This 4-page student activity packet features two authentic synthetic data tables detailing post-prandial blood glucose regulation (Part A) and cold-exposure thermoregulation (Part B). Across 10 multi-part analysis tasks, students identify numerical extrema, determine response delays, explain antagonistic hormone secretion, analyze vascular and metabolic compensation, evaluate experimental sampling rates, and identify biological variables influencing homeostatic response curves. A complete 2-page teacher answer key provides thorough explanations and physiological benchmarks.
Skill Progression
- Guided Practice (Tasks 1–2 & 6–7): Students read tables directly to identify baseline conditions, peak hormone levels, and minimum cutaneous blood flow values while calculating stimulus-response time lags with explicit prompt cues.
- Supported Practice (Tasks 3–4 & 8–9): Students explain causal mechanisms, comparing how paired hormones (insulin and glucagon) or compensatory effectors (cutaneous vasoconstriction, shivering thermogenesis, and the core temperature afterdrop) restore set points.
- Independent Practice (Tasks 5 & 10): Students synthesize complex systems thinking by critiquing discrete sampling limitations and evaluating how individual physiological traits like surface-area-to-volume ratio alter response dynamics.
This gradual-release sequence transitions learners from direct data extraction to higher-order systems analysis.
Standards Alignment
This resource aligns with high school life science standards requiring students to analyze data and develop conceptual models illustrating how negative feedback mechanisms maintain dynamic equilibrium in biological systems. Students demonstrate how multicellular organisms detect stimuli, transmit hormonal or neural signals, and engage effectors to maintain stability. These standard descriptions can be copied directly into lesson plans, IEP goals, or curriculum mapping tools.
How to Use It
Deploy this worksheet after direct instruction on negative feedback loops as an intensive mid-unit data lab, or assign Part A and Part B across endocrine and thermoregulation lessons. During independent work, check Part A Task 2 to verify that students recognize the temporal delay between blood glucose peaks and insulin peaks rather than assuming simultaneous responses. Typical completion time is 45 to 60 minutes.
Who It's For
This resource is designed for Grade 10 General Biology, Honors Biology, and introductory AP Biology courses. It offers targeted support for developing data literacy while providing sufficient analytical depth for advanced learners. Pair this worksheet with an interactive homeostasis graph simulation or an endocrine feedback pathway diagram to anchor student understanding.
According to educational research in science literacy and gradual-release instruction by Fisher & Frey (2014), structured data analysis tasks that require students to translate quantitative time-series tables into conceptual biological models significantly enhance systems-level comprehension. By analyzing 10 rigorous, multi-tiered problems covering glucose regulation and thermoregulation across 4 pages, high school biology students develop the analytical skills necessary to evaluate negative feedback, explain dynamic equilibrium, and account for physiological response lags in living organisms. Furthermore, engaging directly with empirical data trends allows secondary learners to bridge mathematical reasoning with biological phenomena, reinforcing how compensatory effectors counteract environmental perturbations to restore homeostatic set points. This deliberate instructional scaffolding builds lasting scientific literacy, strengthens data interpretation proficiencies, and equips tenth-grade learners with the practical quantitative confidence needed to interpret complex regulatory feedback loops across diverse biological systems.


