


0
Views
0
Downloads
0.0
0
Save
0 Likes
Reading Graph Worksheet for Data Interpretation
0 Views
0 Downloads
Paste this activity's link or code into your existing LMS (Google Classroom, Canvas, Teams, Schoology, Moodle, etc.).
Students can open and work on the activity right away, with no student login required.
You'll still be able to track student progress and results from your teacher account.
Information
Description
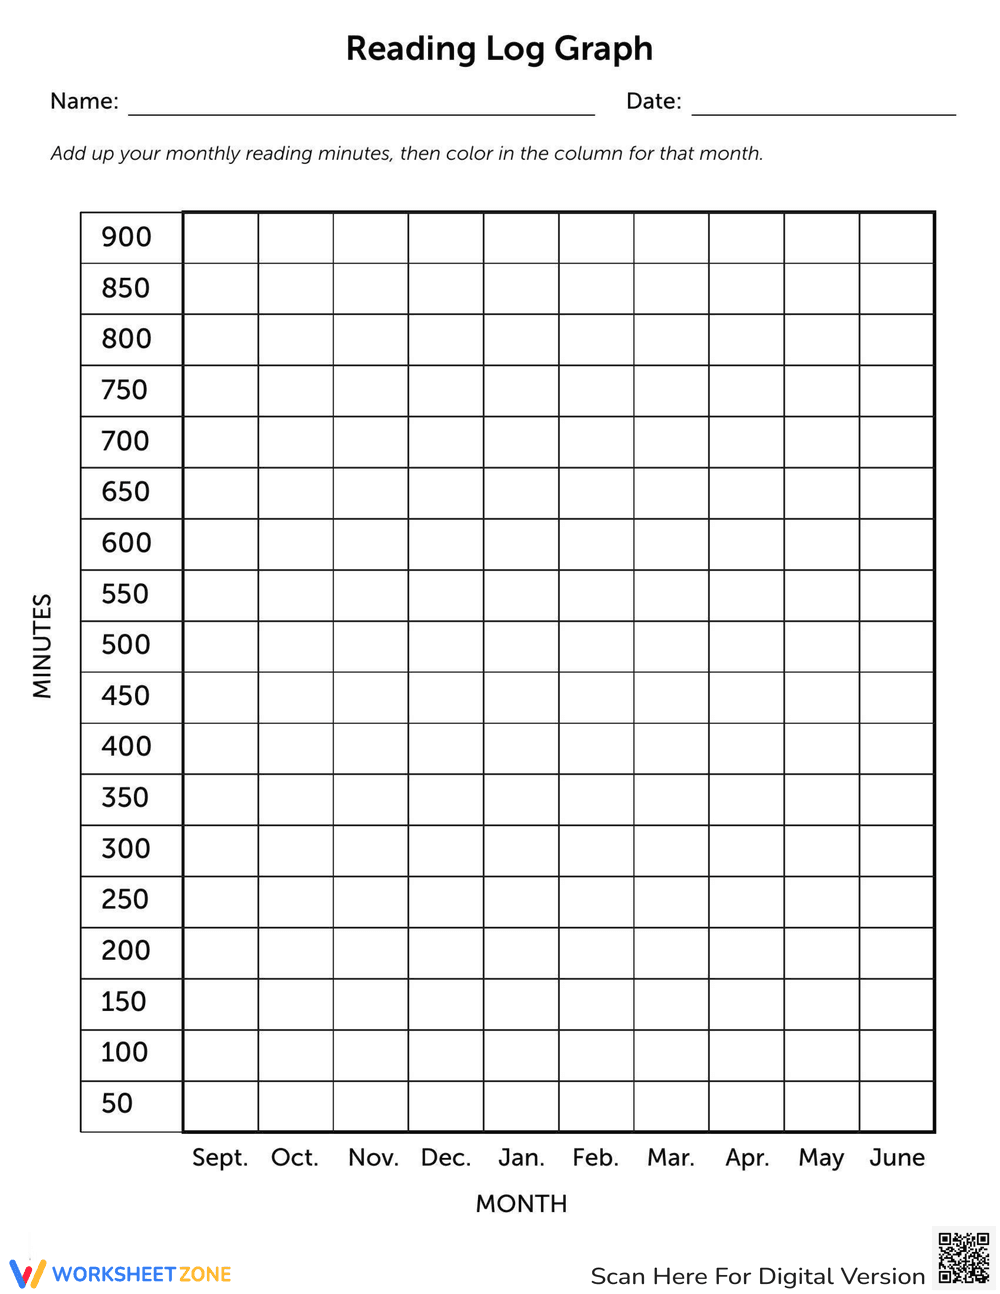
What It Is:
This is a reading log graph worksheet. It allows students to track their monthly reading minutes from September to June. The graph has a vertical axis labeled 'Minutes' ranging from 50 to 900 in increments of 50, and a horizontal axis labeled 'Month' with each month represented. Students are instructed to add up their reading minutes for each month and then color in the column corresponding to that month's total. There are also spaces for the student's name and the date.
Grade Level Suitability:
This worksheet is suitable for grades 2-5. The concept of graphing and tracking reading minutes is appropriate for these grades. The numerical values and the simple instructions make it accessible to this age range.
Why Use It:
This worksheet helps students develop a habit of tracking their reading progress. It visually represents their reading time, motivating them to read more. It also reinforces graphing skills and data analysis in a practical context.
How to Use It:
First, have the student write their name and the date at the top. Then, at the end of each month, the student should add up their total reading minutes for that month. Finally, they should color in the column corresponding to that month up to the level that matches their total reading minutes. For example, if they read for 300 minutes in October, they would color in the October column up to the 300 mark.
Target Users:
This worksheet is designed for elementary school students, specifically those in grades 2-5, who are learning to track their reading habits and understand basic graphing concepts. It is also useful for teachers and parents who want to encourage reading and monitor student progress.