


Views
Downloads
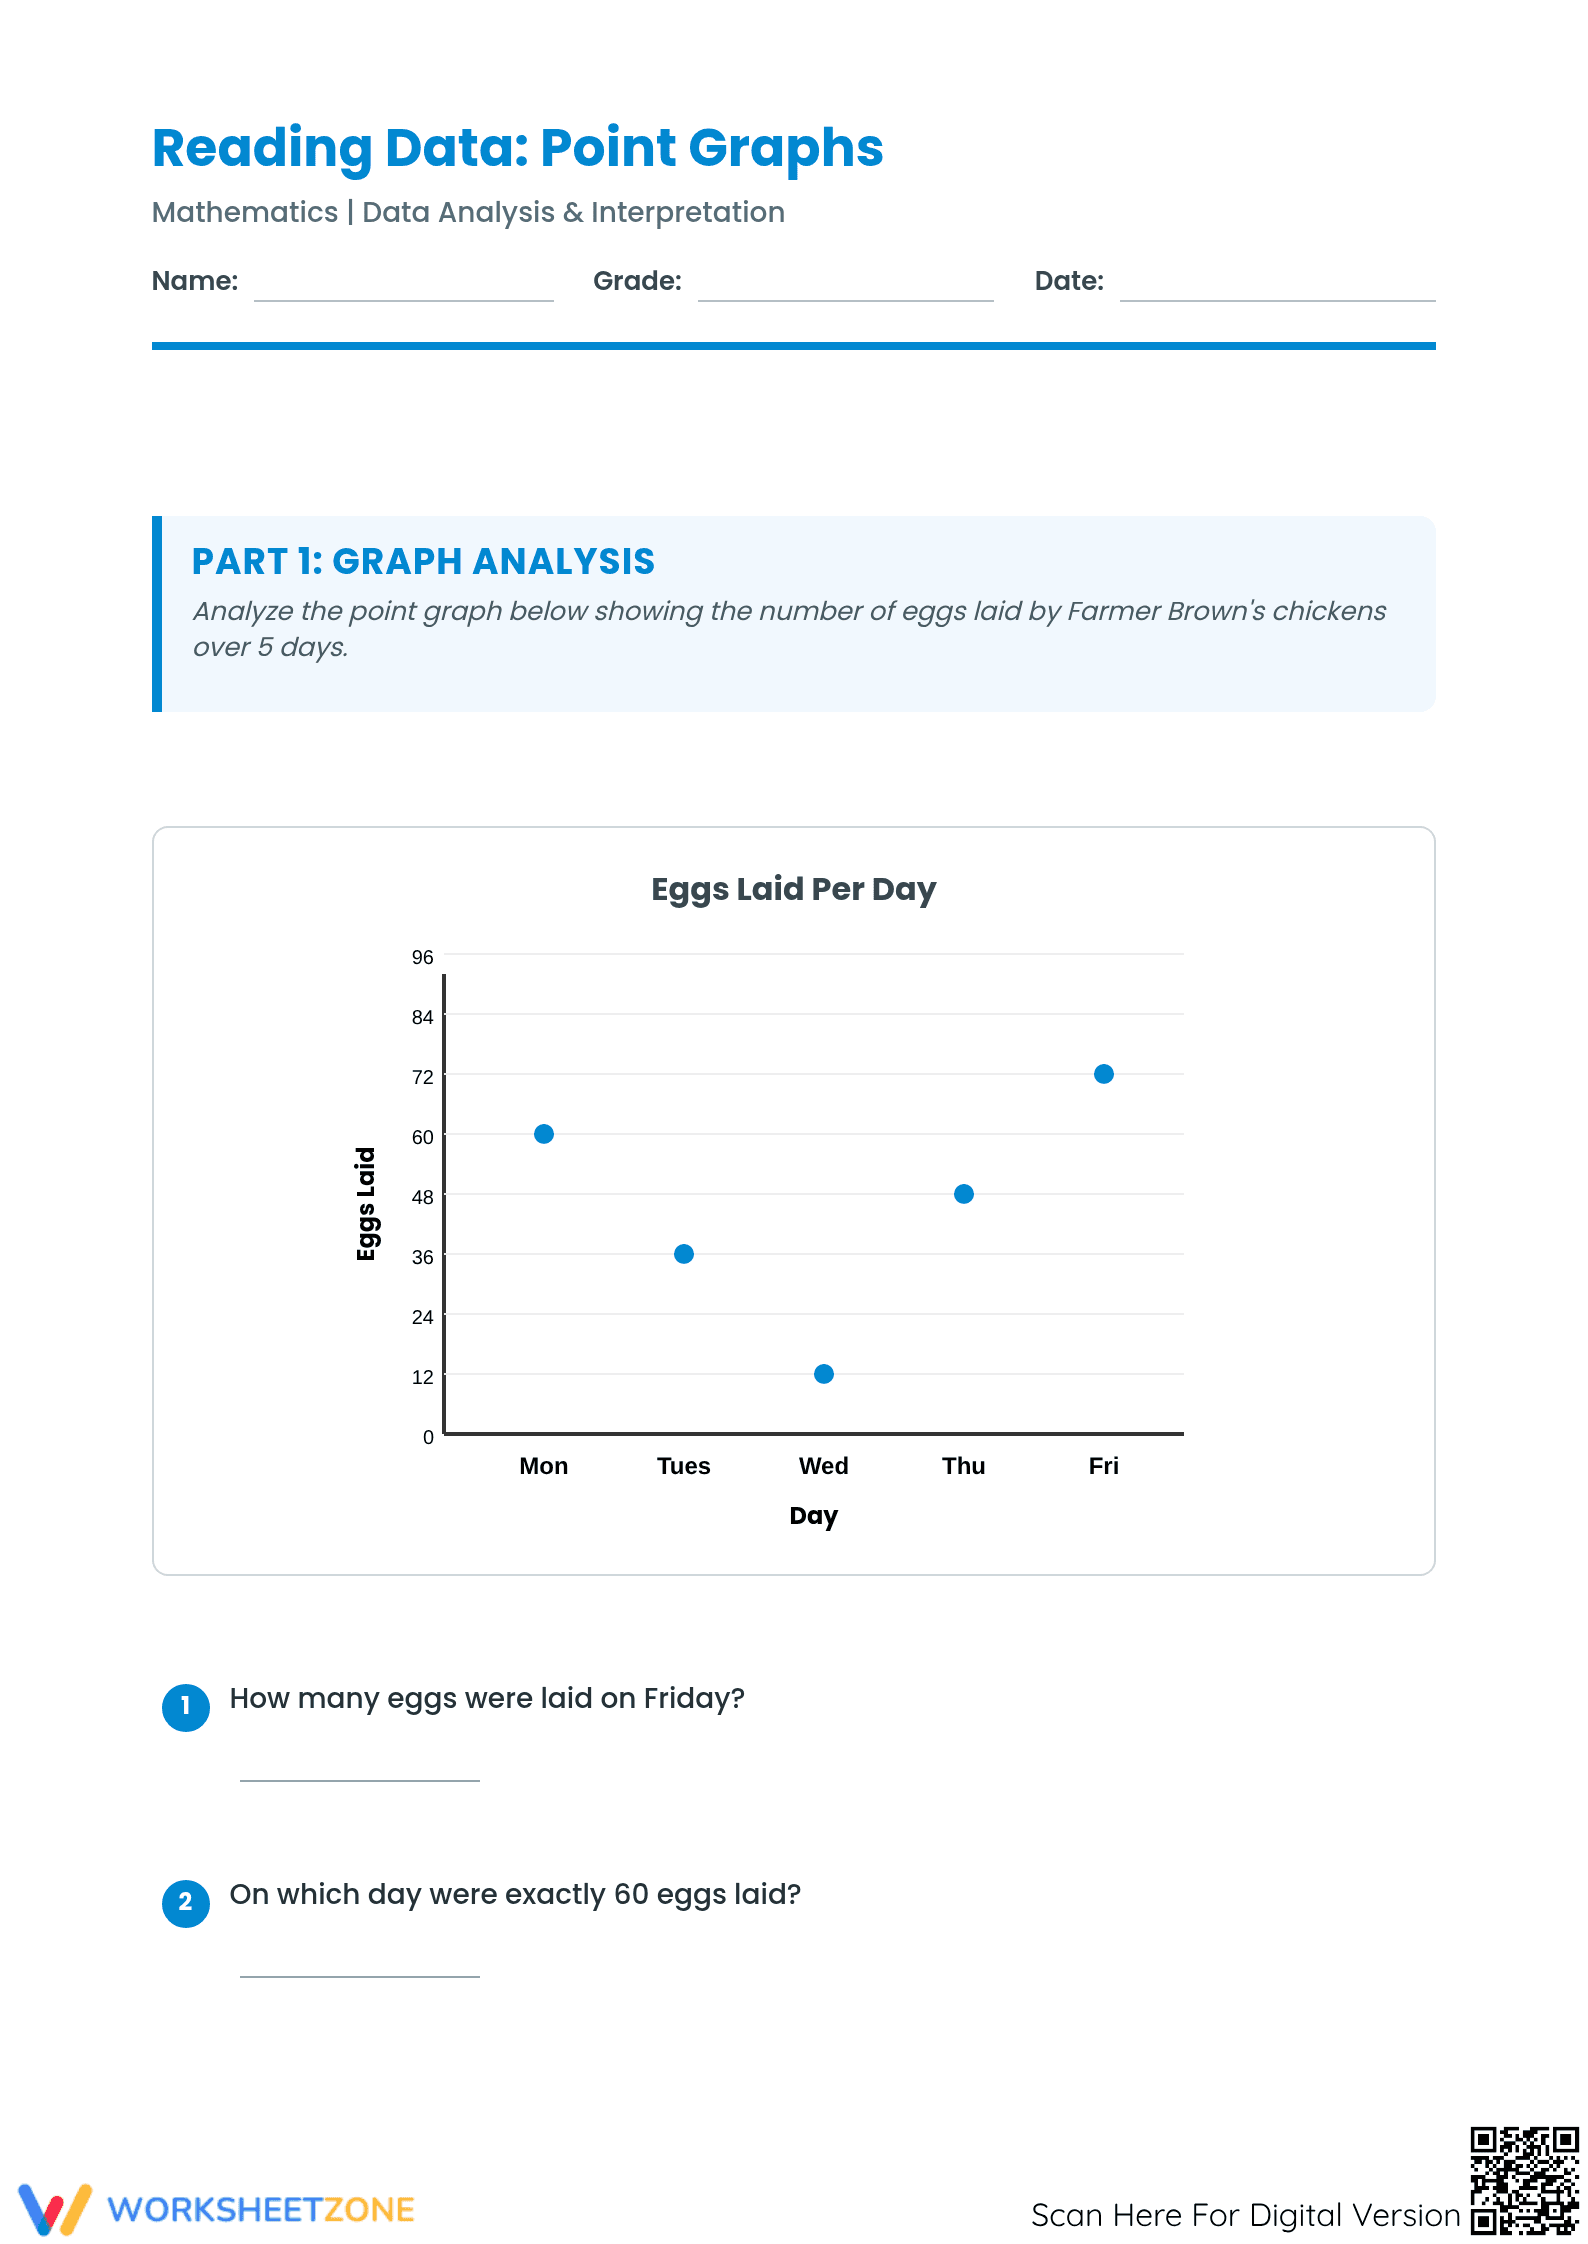
Grade 5 Reading Line Graphs — Printable No-Prep Worksheet
Paste this activity's link or code into your existing LMS (Google Classroom, Canvas, Teams, Schoology, Moodle, etc.).
Students can open and work on the activity right away, with no student login required.
You'll still be able to track student progress and results from your teacher account.
This worksheet offers targeted practice for Grade 5 students in reading and interpreting line graphs. Through clear, real-world scenarios, students analyze trends, compare data points, and answer specific questions, strengthening foundational data analysis skills.
At a Glance
- Grade: 5 · Subject: Math
- Standard:
CCSS.MATH.CONTENT.5.G.A.2— Interpret coordinate values of points in context.- Skill Focus: Reading and Interpreting Line Graphs
- Format: 3 pages · 30 problems · Answer key included · PDF
- Best For: Independent practice, homework, or formative assessment.
- Time: 20–30 minutes
What's Inside
This resource includes three student practice pages and a complete, one-page answer key for easy grading. It presents six distinct line graphs, each with five questions. The clean layout ensures students focus on interpreting data without distraction.
A Zero-Prep Workflow
Designed for efficiency, this worksheet offers a simple, three-step workflow. Just print the three student pages, distribute for immediate use, and review with the provided answer key. Total teacher prep time is under two minutes, making it ideal for substitutes, last-minute activities, or quick homework.
Standards Alignment
Directly aligned with Common Core standard CCSS.MATH.CONTENT.5.G.A.2, this worksheet focuses on interpreting coordinate values in context. The standard requires students to "Represent real world and mathematical problems by graphing points in the first quadrant of the coordinate plane, and interpret coordinate values of points in the context of the situation." This resource heavily emphasizes interpreting coordinate values (e.g., time and quantity) in context, and both the standard code and its description can be used in lesson plans or curriculum mapping.
How to Use It
Use this worksheet as independent practice after direct instruction on line graphs. It's an excellent tool to gauge student understanding before more complex data representation tasks. For formative assessment, observe if students correctly track from the x-axis to the line and then to the y-axis, quickly identifying foundational misunderstandings. Most students will complete the 30 questions in approximately 20 to 30 minutes.
Who It's For
Designed for Grade 5 students, this resource also suits advanced 4th graders or 6th graders needing review of data interpretation fundamentals. Its clear structure and real-world topics (e.g., plant growth, ticket sales) engage the target age group. For struggling learners, consider completing the first graph together. This worksheet pairs well with lessons on creating anchor charts that define graph axes and titles.
This practice worksheet reinforces interpreting real-world data, a skill central to standard CCSS.MATH.CONTENT.5.G.A.2. By interpreting coordinate values within context, it builds a foundation for advanced statistical reasoning. Research shows structured practice with data representations is critical for mathematical literacy. This resource offers focused practice to build proficiency, connecting mathematical procedures to tangible scenarios like plant height and ticket sales, consistent with findings on purposeful, application-based tasks in math instruction.