


0
Views
0
Downloads
0.0
0
Save
0 Likes
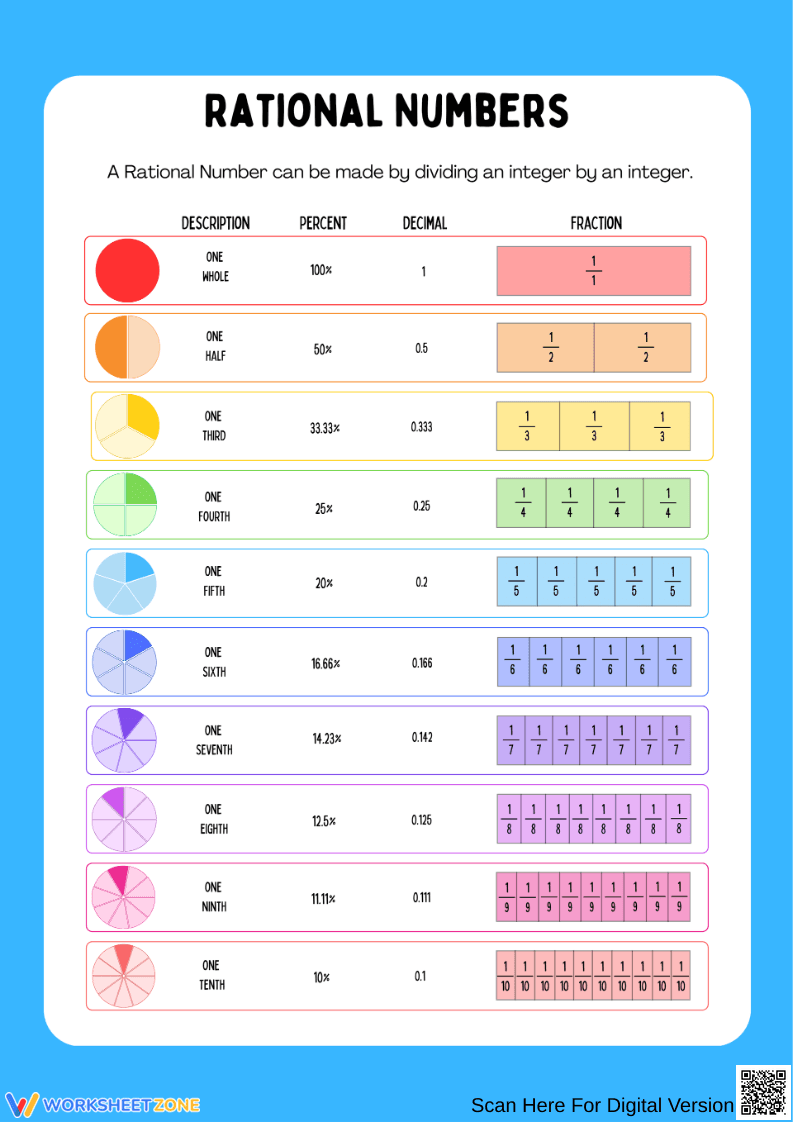
Rational Numbers Chart Worksheet (Fractions, Decimals, Percents)
0 Views
0 Downloads
Paste this activity's link or code into your existing LMS (Google Classroom, Canvas, Teams, Schoology, Moodle, etc.).
Students can open and work on the activity right away, with no student login required.
You'll still be able to track student progress and results from your teacher account.
Information
Description
What It Is:
A colorful reference chart that illustrates how rational numbers can be represented as fractions, decimals, and percentages.
Why Use It:
Helps students visualize the connection between different forms of rational numbers and strengthens their understanding of numerical relationships.
How to Use It:
• Review each example to see how fractions convert to decimals and percents.
• Compare different rational numbers to understand proportional values.
• Use as a classroom visual aid or study reference for quick conversions.
Grade Suitability:
Best for Grades 9–11.
• Grade 9: Reinforces the fundamentals of rational number representation.
• Grade 10: Supports conversion practice in algebra and real-world contexts.
• Grade 11: Strengthens numerical fluency for higher-level math and problem solving.
Target Users:
Teachers, students, and homeschool educators looking for a clear and engaging rational numbers chart to enhance conceptual understanding.