


Views
Downloads
Grade 8-10 Punnett Squares — Printable No-Prep Worksheet
Paste this activity's link or code into your existing LMS (Google Classroom, Canvas, Teams, Schoology, Moodle, etc.).
Students can open and work on the activity right away, with no student login required.
You'll still be able to track student progress and results from your teacher account.
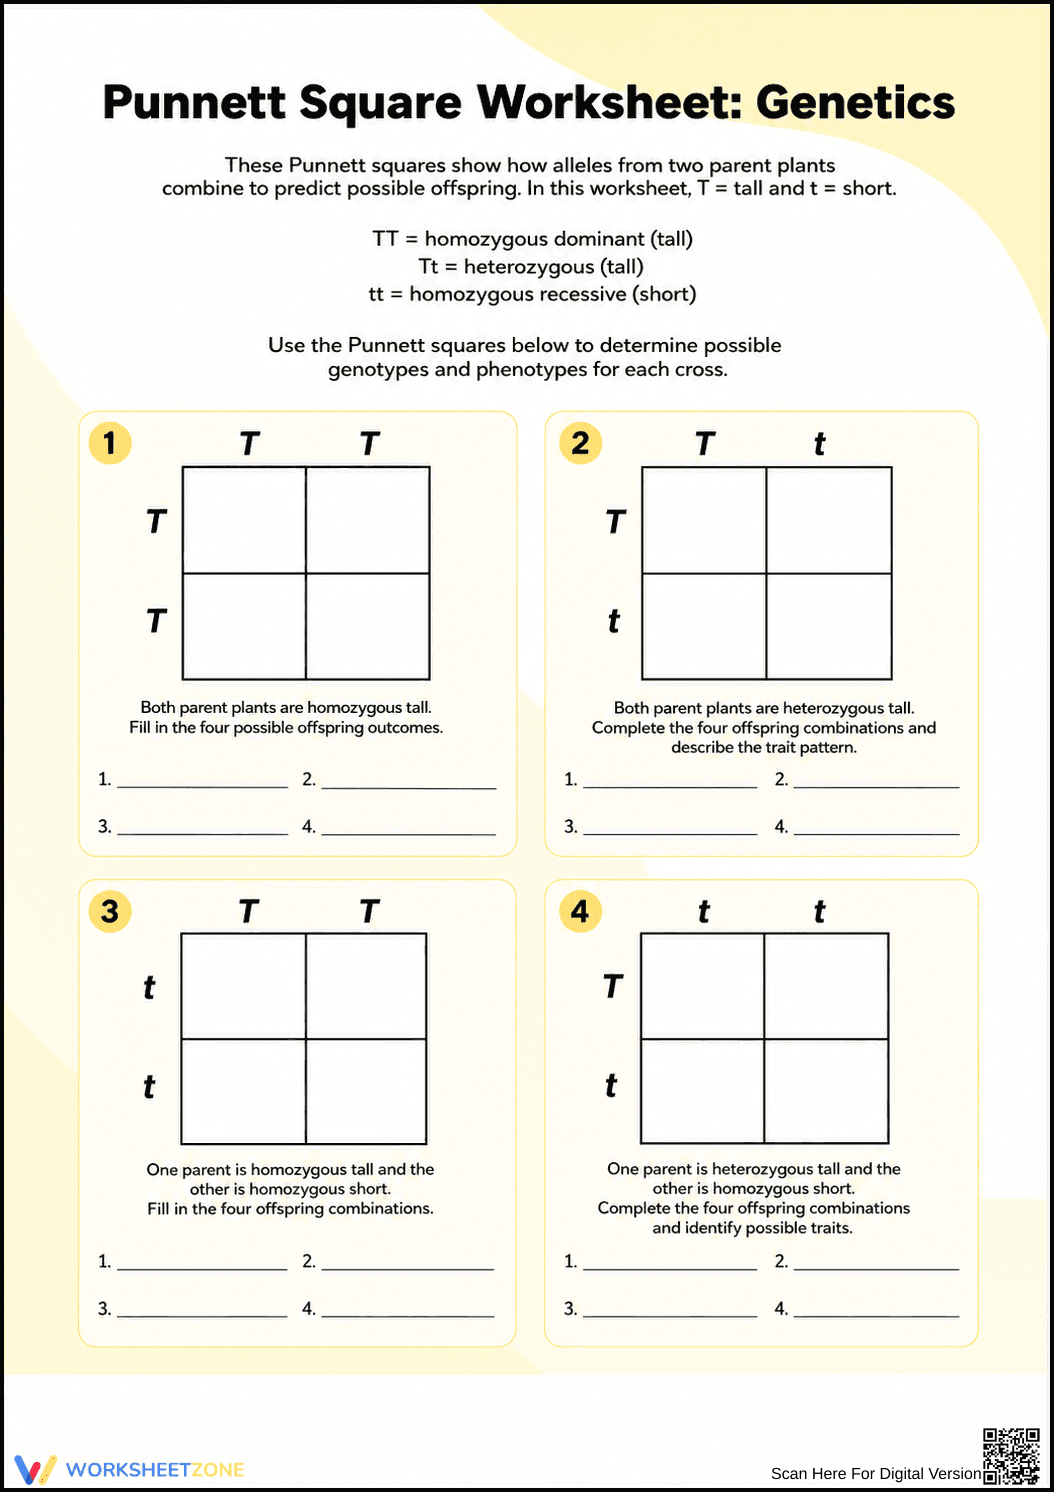
This Grade 8-10 biology resource provides immediate practice with Mendelian inheritance patterns. Students use four distinct Punnett square scenarios to calculate the probability of offspring genotypes and phenotypes based on parental alleles. By completing these visual diagrams, learners bridge the gap between abstract genetic theory and concrete mathematical prediction.
At a Glance
- Grade: 8-10 · Subject: Biology
- Standard:
MS-LS3-2— Develop a model to describe why gene variations result in offspring traits- Skill Focus: Punnett Square Probability
- Format: 1 page · 4 problems · Answer key included · PDF
- Best For: Independent practice or formative assessment
- Time: 15–20 minutes
The worksheet features a clean layout containing four specific genetic crosses: homozygous dominant, heterozygous, and homozygous recessive pairings. Each section includes a 2x2 grid and four numbered lines for students to record findings. To support independent work, the top of the page provides a reference key defining homozygous dominant (TT), heterozygous (Tt), and homozygous recessive (tt) traits.
Zero-Prep Workflow
- Print: Generate the single-page PDF for your entire class in under 30 seconds.
- Distribute: Hand out the sheets as a bell-ringer activity or a focused exit ticket to check for understanding.
- Review: Use the included answer key to identify common misconceptions regarding dominant versus recessive expression in under 5 minutes.
This resource is an ideal solution for substitute plans or sudden schedule changes where high-quality instructional materials are needed instantly.
Standards Alignment
Aligned to `MS-LS3-2`, this worksheet requires students to develop a model to describe how gene variations on chromosomes can result in such a wide range of individual traits. It also supports `HS-LS3-3` by challenging students to apply concepts of statistics and probability to explain the variation and distribution of expressed traits in a population. Both standard codes can be copied directly into lesson plans, IEP goals, or district curriculum mapping tools.
How to Use It
Use this worksheet during the guided practice phase of a genetics unit. After introducing Gregor Mendel’s pea plant experiments, assign this sheet to verify that students can correctly distribute parental alleles across the axes. As a formative assessment tip, walk the room and check Square 2 (Tt x Tt); students who struggle to identify the 3:1 phenotypic ratio often need a quick re-teaching of the recessive trait in hybrids. Expected completion time is 15 to 20 minutes.
Who It's For
This activity is tailored for middle school life science and introductory high school biology students. It is particularly effective for visual learners who need to see the physical combination of letters to understand probability. It pairs naturally with a direct instruction lesson on Mendelian laws or a digital simulation of plant breeding to provide a comprehensive learning experience.
According to the RAND AIRS 2024 report on secondary science instruction, the use of structured visual models like Punnett squares is critical for internalizing the mechanisms of heredity. This worksheet facilitates the transition from rote memorization of vocabulary to the active application of MS-LS3-2 standards. By requiring students to manually fill 16 individual offspring cells across four different scenarios, the resource reinforces the mathematical nature of genetic inheritance. Research indicates that repetitive, focused practice on monohybrid crosses significantly reduces cognitive load when students eventually progress to more complex dihybrid or non-Mendelian patterns. This printable tool ensures that the foundational logic of allele segregation is mastered before higher-order analysis begins. It serves as a reliable evidence-based artifact for student portfolios or progress monitoring in inclusive science classrooms.