


Views
Downloads
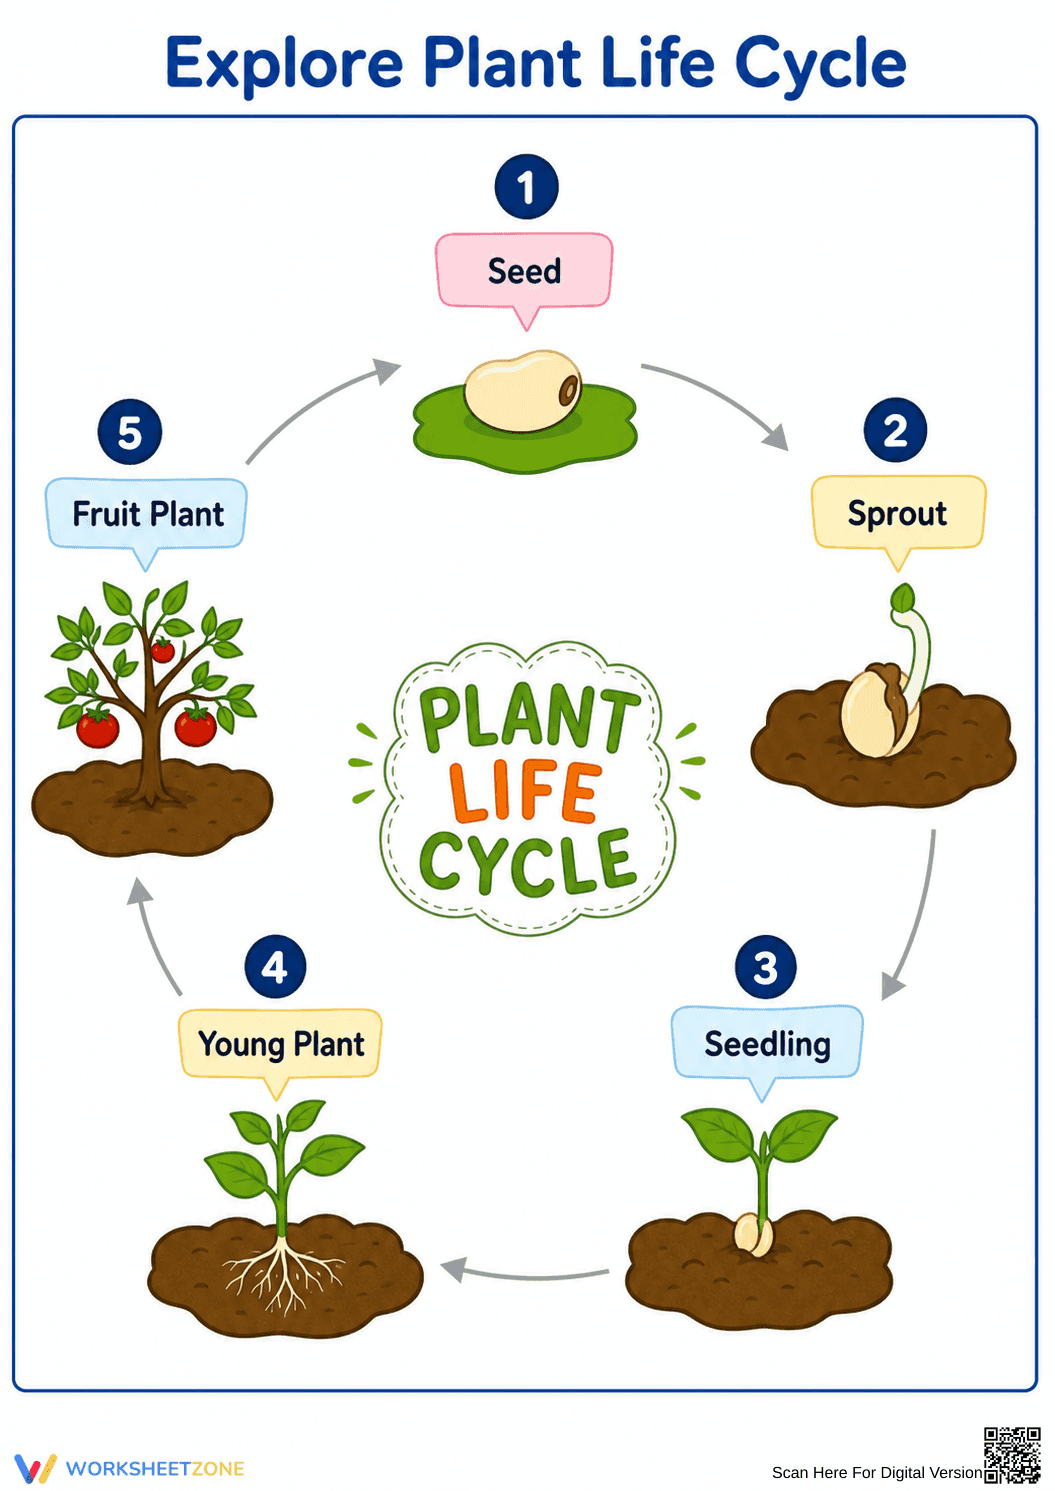
Printable Plant Life Cycle Diagram | Grade 3 Science
Paste this activity's link or code into your existing LMS (Google Classroom, Canvas, Teams, Schoology, Moodle, etc.).
Students can open and work on the activity right away, with no student login required.
You'll still be able to track student progress and results from your teacher account.
This visual reference diagram introduces students to the fundamental stages of plant growth and reproduction. By tracing the path from a simple seed to a mature, fruit-bearing plant, learners build foundational science vocabulary and grasp how living organisms develop over time in a continuous, predictable sequence.
At a Glance
- Grade: 3 · Subject: Science
- Standard:
3-LS1-1— Describe that organisms have unique and diverse life cycles- Skill Focus: Plant Life Cycle
- Format: 1 page · 5 stages · No answer key needed · PDF
- Best For: Visual reference and anchor charts
- Time: 5–10 minutes
This single-page printable features a clear, full-color circular diagram illustrating the five key stages of a plant's life. It includes numbered, color-coded labels for a seed, sprout, seedling, young plant, and fruit plant. The directional arrows guide students naturally through the biological progression, making complex scientific concepts accessible and easy to follow without requiring additional reading materials or complex instructions.
Designed for immediate classroom implementation, this resource requires absolutely zero teacher preparation:
- Print (1 minute): Simply print the high-resolution PDF in color or grayscale.
- Distribute (1 minute): Hand out to students as a reference sheet or display it on a smartboard.
- Review (3 minutes): Walk through the five numbered stages together as a class.
With a total prep time of under two minutes, this diagram is an excellent addition to any emergency sub plan or spontaneous science mini-lesson.
This resource is aligned to the Next Generation Science Standards, specifically focusing on 3-LS1-1: Develop models to describe that organisms have unique and diverse life cycles but all have in common birth, growth, reproduction, and death. It provides the visual model necessary for students to understand the growth and reproduction phases of a plant. Both standard codes can be copied directly into lesson plans, IEP goals, or district curriculum mapping tools.
Teachers can utilize this diagram in multiple instructional contexts. Before a direct instruction lesson on botany or ecosystems, display the chart to activate prior knowledge and introduce key vocabulary. During independent science stations, students can keep this sheet in their folders as a quick reference guide while completing related sequencing activities or reading informational texts. As a formative assessment observation tip, ask students to point to the stage where the plant first begins to make its own food or reproduce, checking for conceptual understanding. Expect the initial review to take between 5 and 10 minutes.
This visual aid is primarily designed for elementary science students learning about biological life cycles. The clear imagery and minimal text make it highly accessible for English Language Learners (ELLs) and students requiring visual accommodations. It pairs perfectly with hands-on seed planting activities, allowing students to compare their real-world observations with the printed model.
Understanding biological progressions through visual models is a critical component of early science education. Aligned with 3-LS1-1, this resource helps students describe that organisms have unique and diverse life cycles. According to a 2024 report by EdReports, integrating clear, sequenced visual aids into science instruction significantly improves vocabulary retention and conceptual mapping for elementary learners. When students can visually trace the path from a dormant seed to a mature, fruit-bearing plant, they develop a stronger foundational schema for broader biological concepts like reproduction, photosynthesis, and ecosystem interdependence. This diagram provides the exact scaffolding needed to bridge the gap between abstract scientific terminology and observable natural phenomena. By utilizing structured visual models, educators ensure that all learners, regardless of reading level, can confidently articulate the stages of plant growth and apply this knowledge to other living organisms.