


























Views
Downloads


Printable Ordering Fractions on a Number Line Worksheet
Paste this activity's link or code into your existing LMS (Google Classroom, Canvas, Teams, Schoology, Moodle, etc.).
Students can open and work on the activity right away, with no student login required.
You'll still be able to track student progress and results from your teacher account.
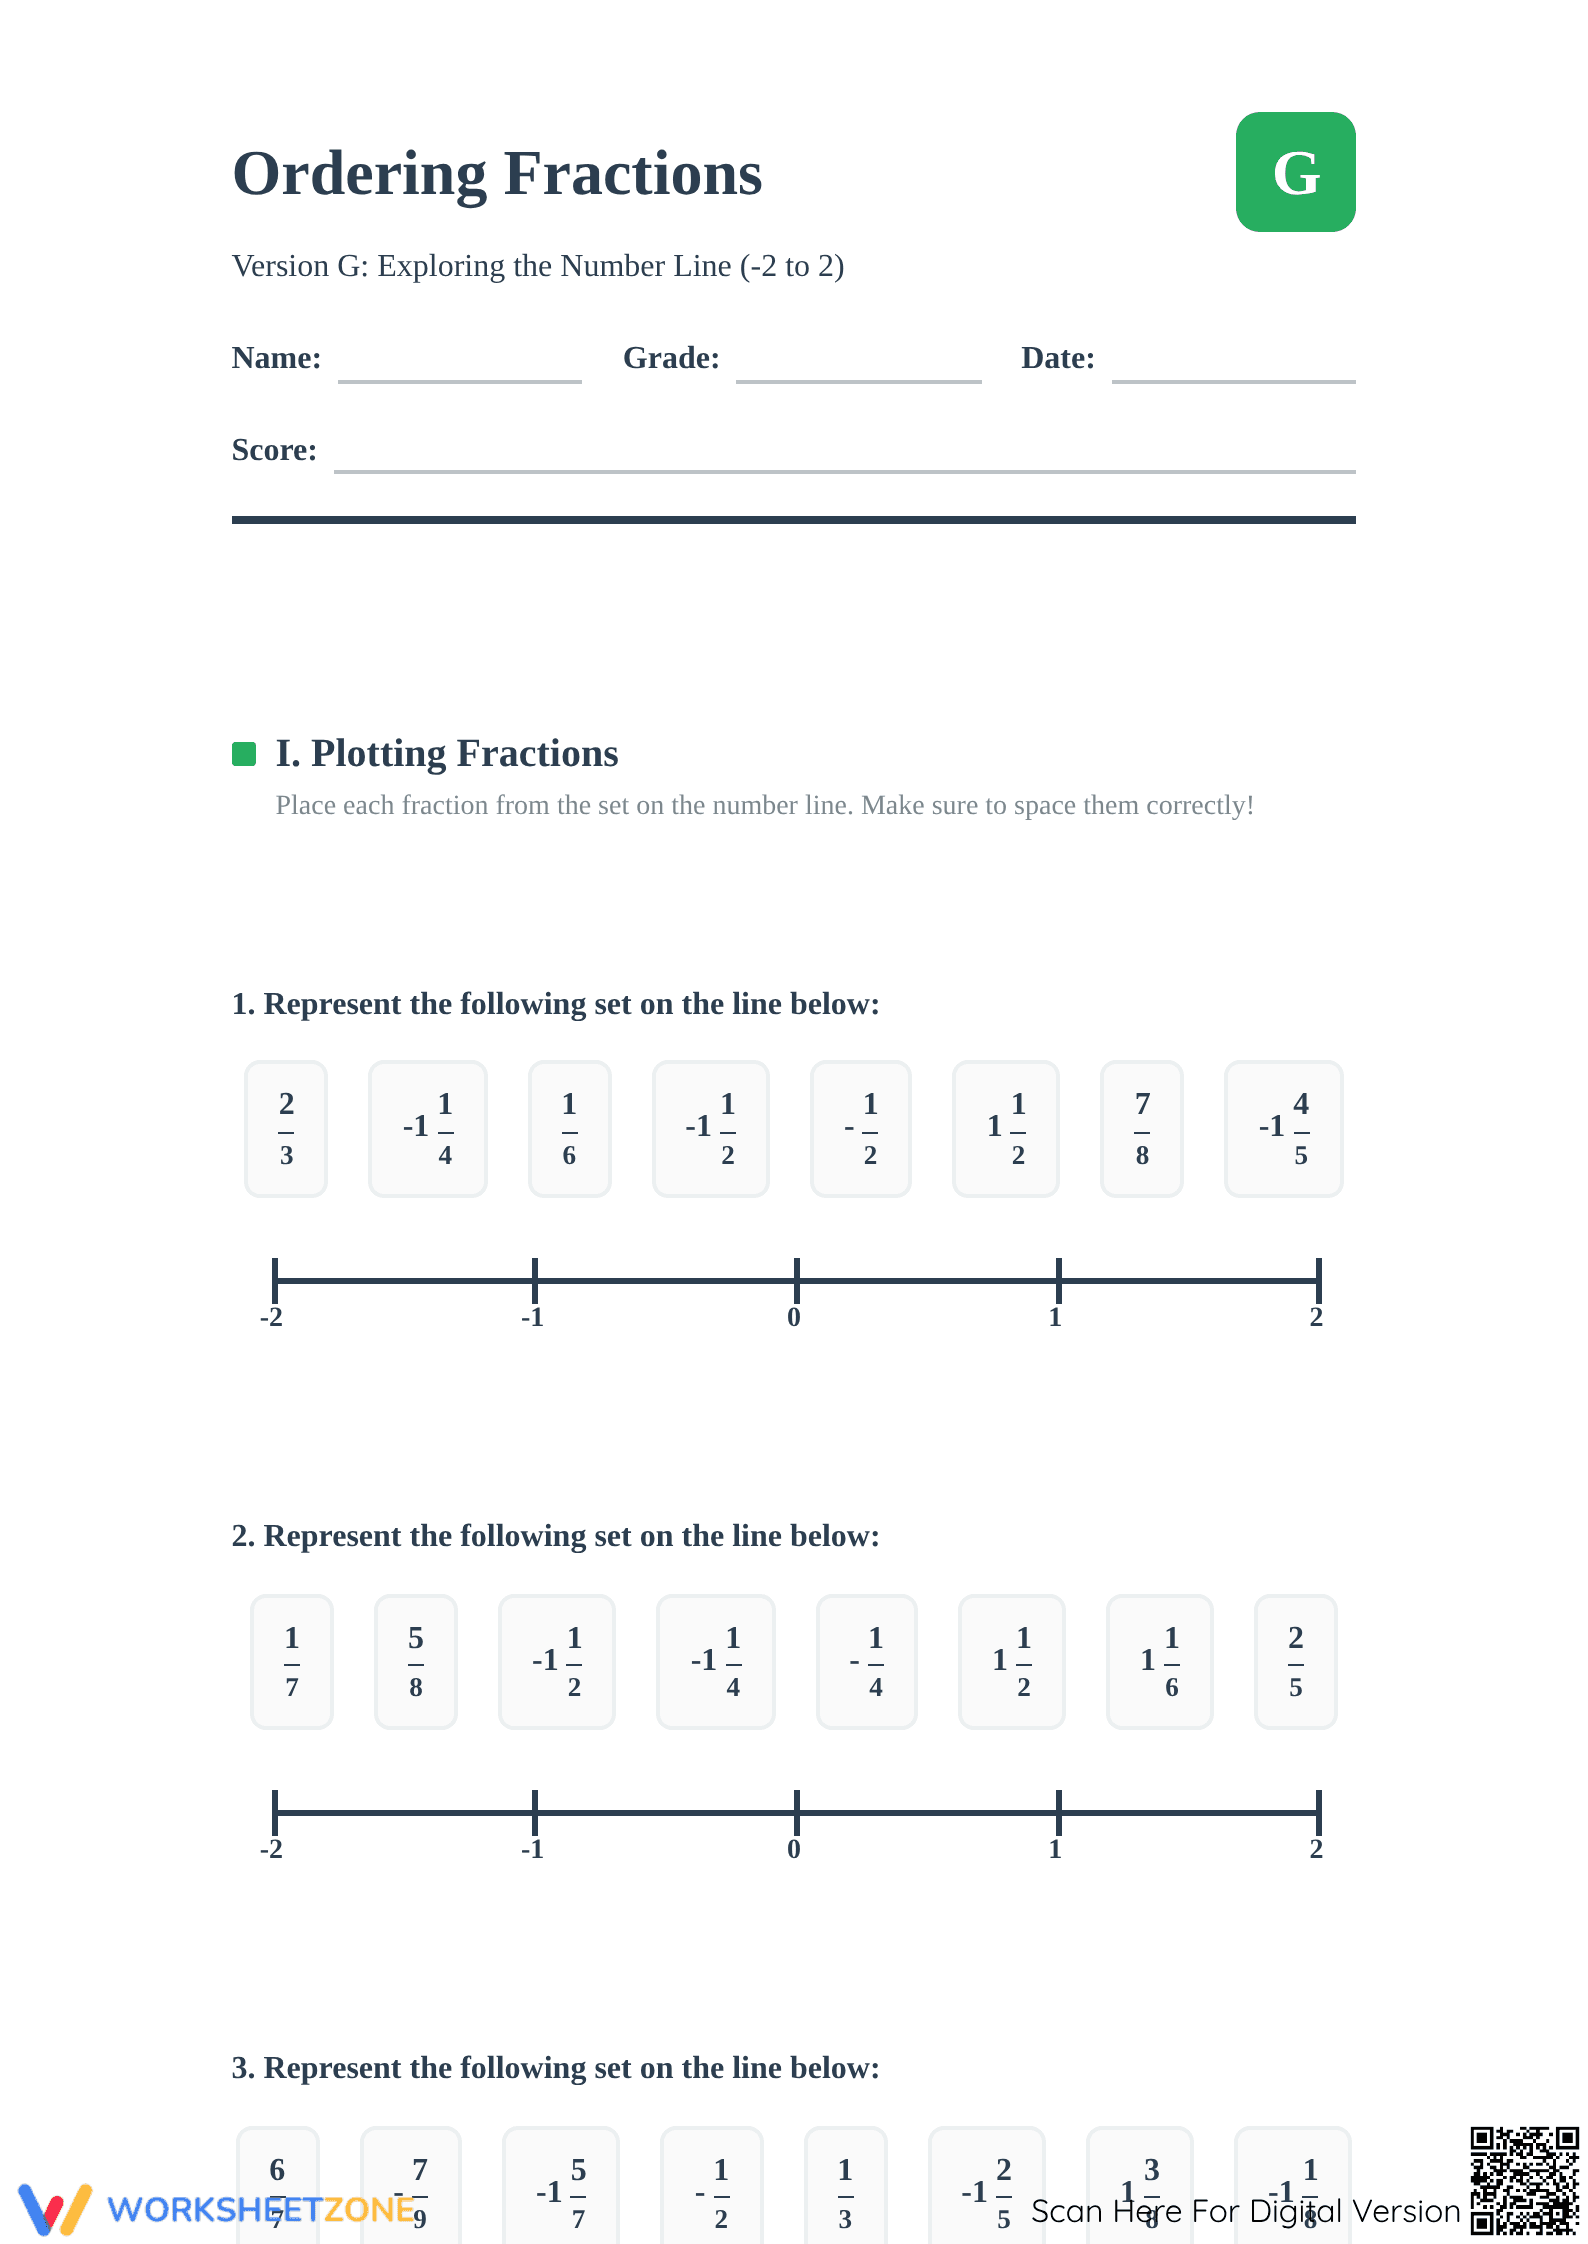
Ordering fractions on a number line is an essential skill bridging abstract values and visual reasoning. This Grade 6 worksheet provides a comprehensive environment to plot, compare, and order rational numbers from -2 to 2. By using visual lines, learners develop a deep conceptual understanding of fraction magnitude and directionality relative to zero and integers.
At a Glance
- Grade: 6 · Subject: Math
- Standard:
CCSS.MATH.CONTENT.6.NS.C.6— Find and position rational numbers on a horizontal number line diagram- Skill Focus: Plotting and ordering fractions (-2 to 2)
- Format: 4 pages · 30+ problems · Answer key included · PDF
- Best For: Independent practice and visual concept reinforcement
- Time: 25–40 minutes
What's Inside
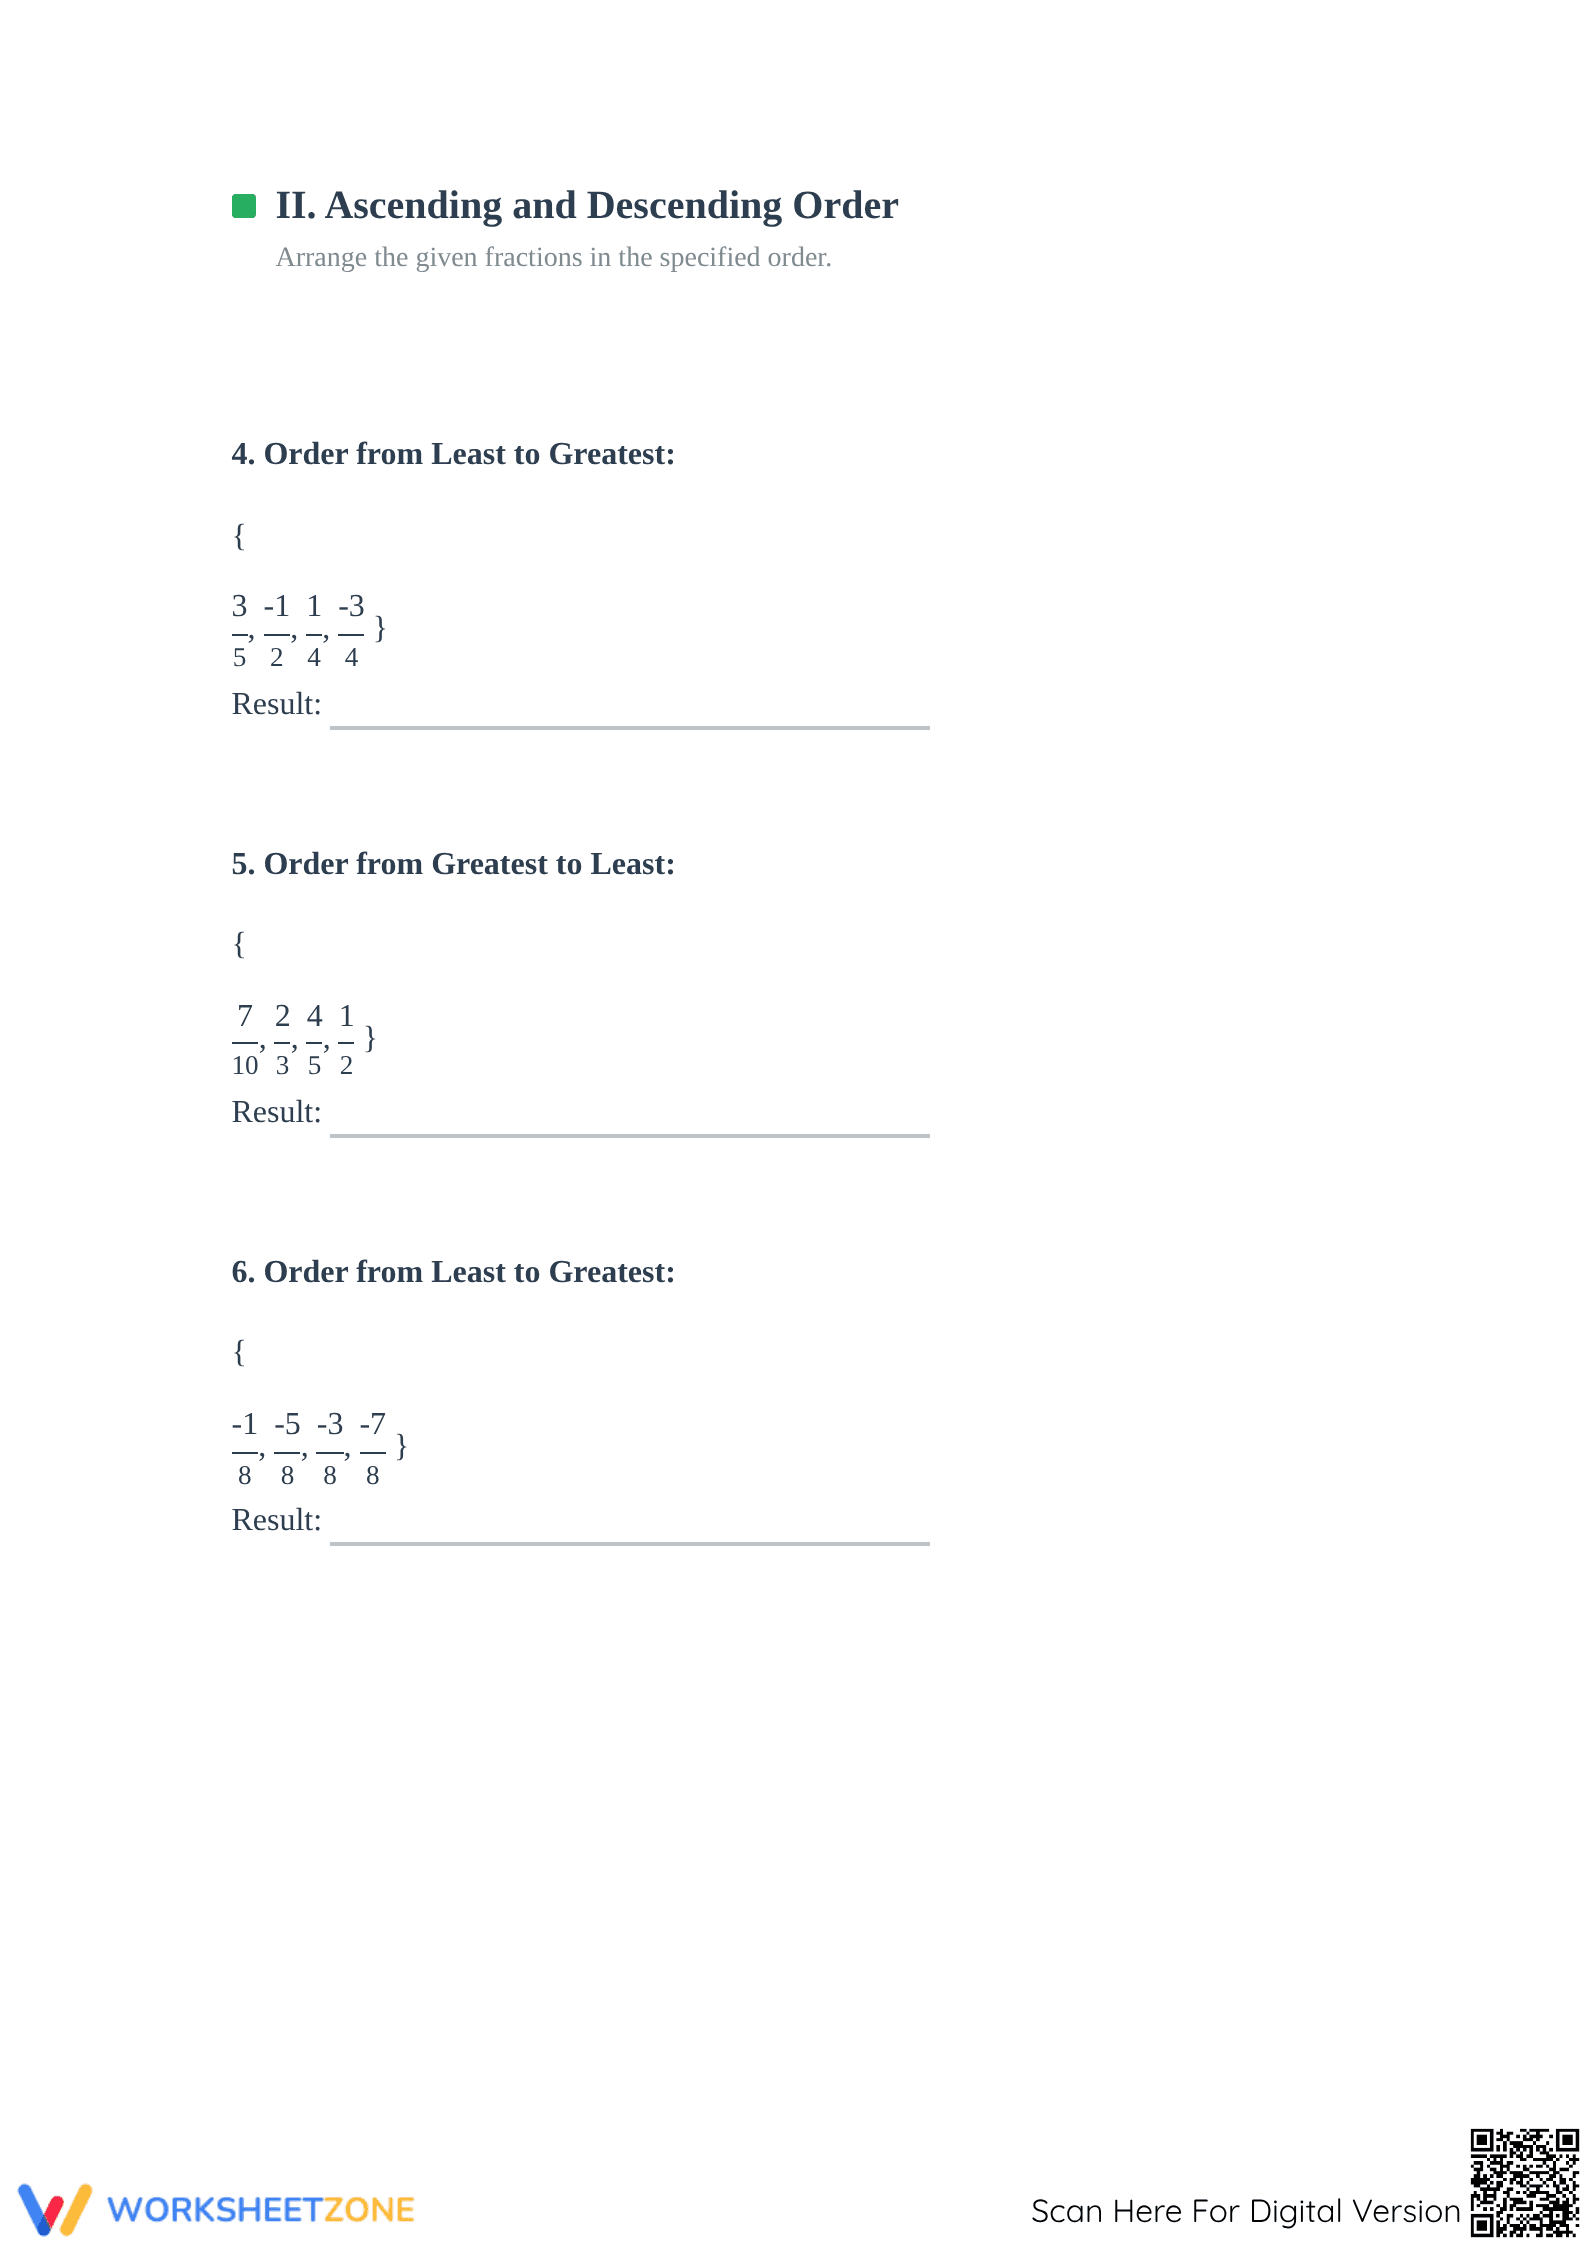
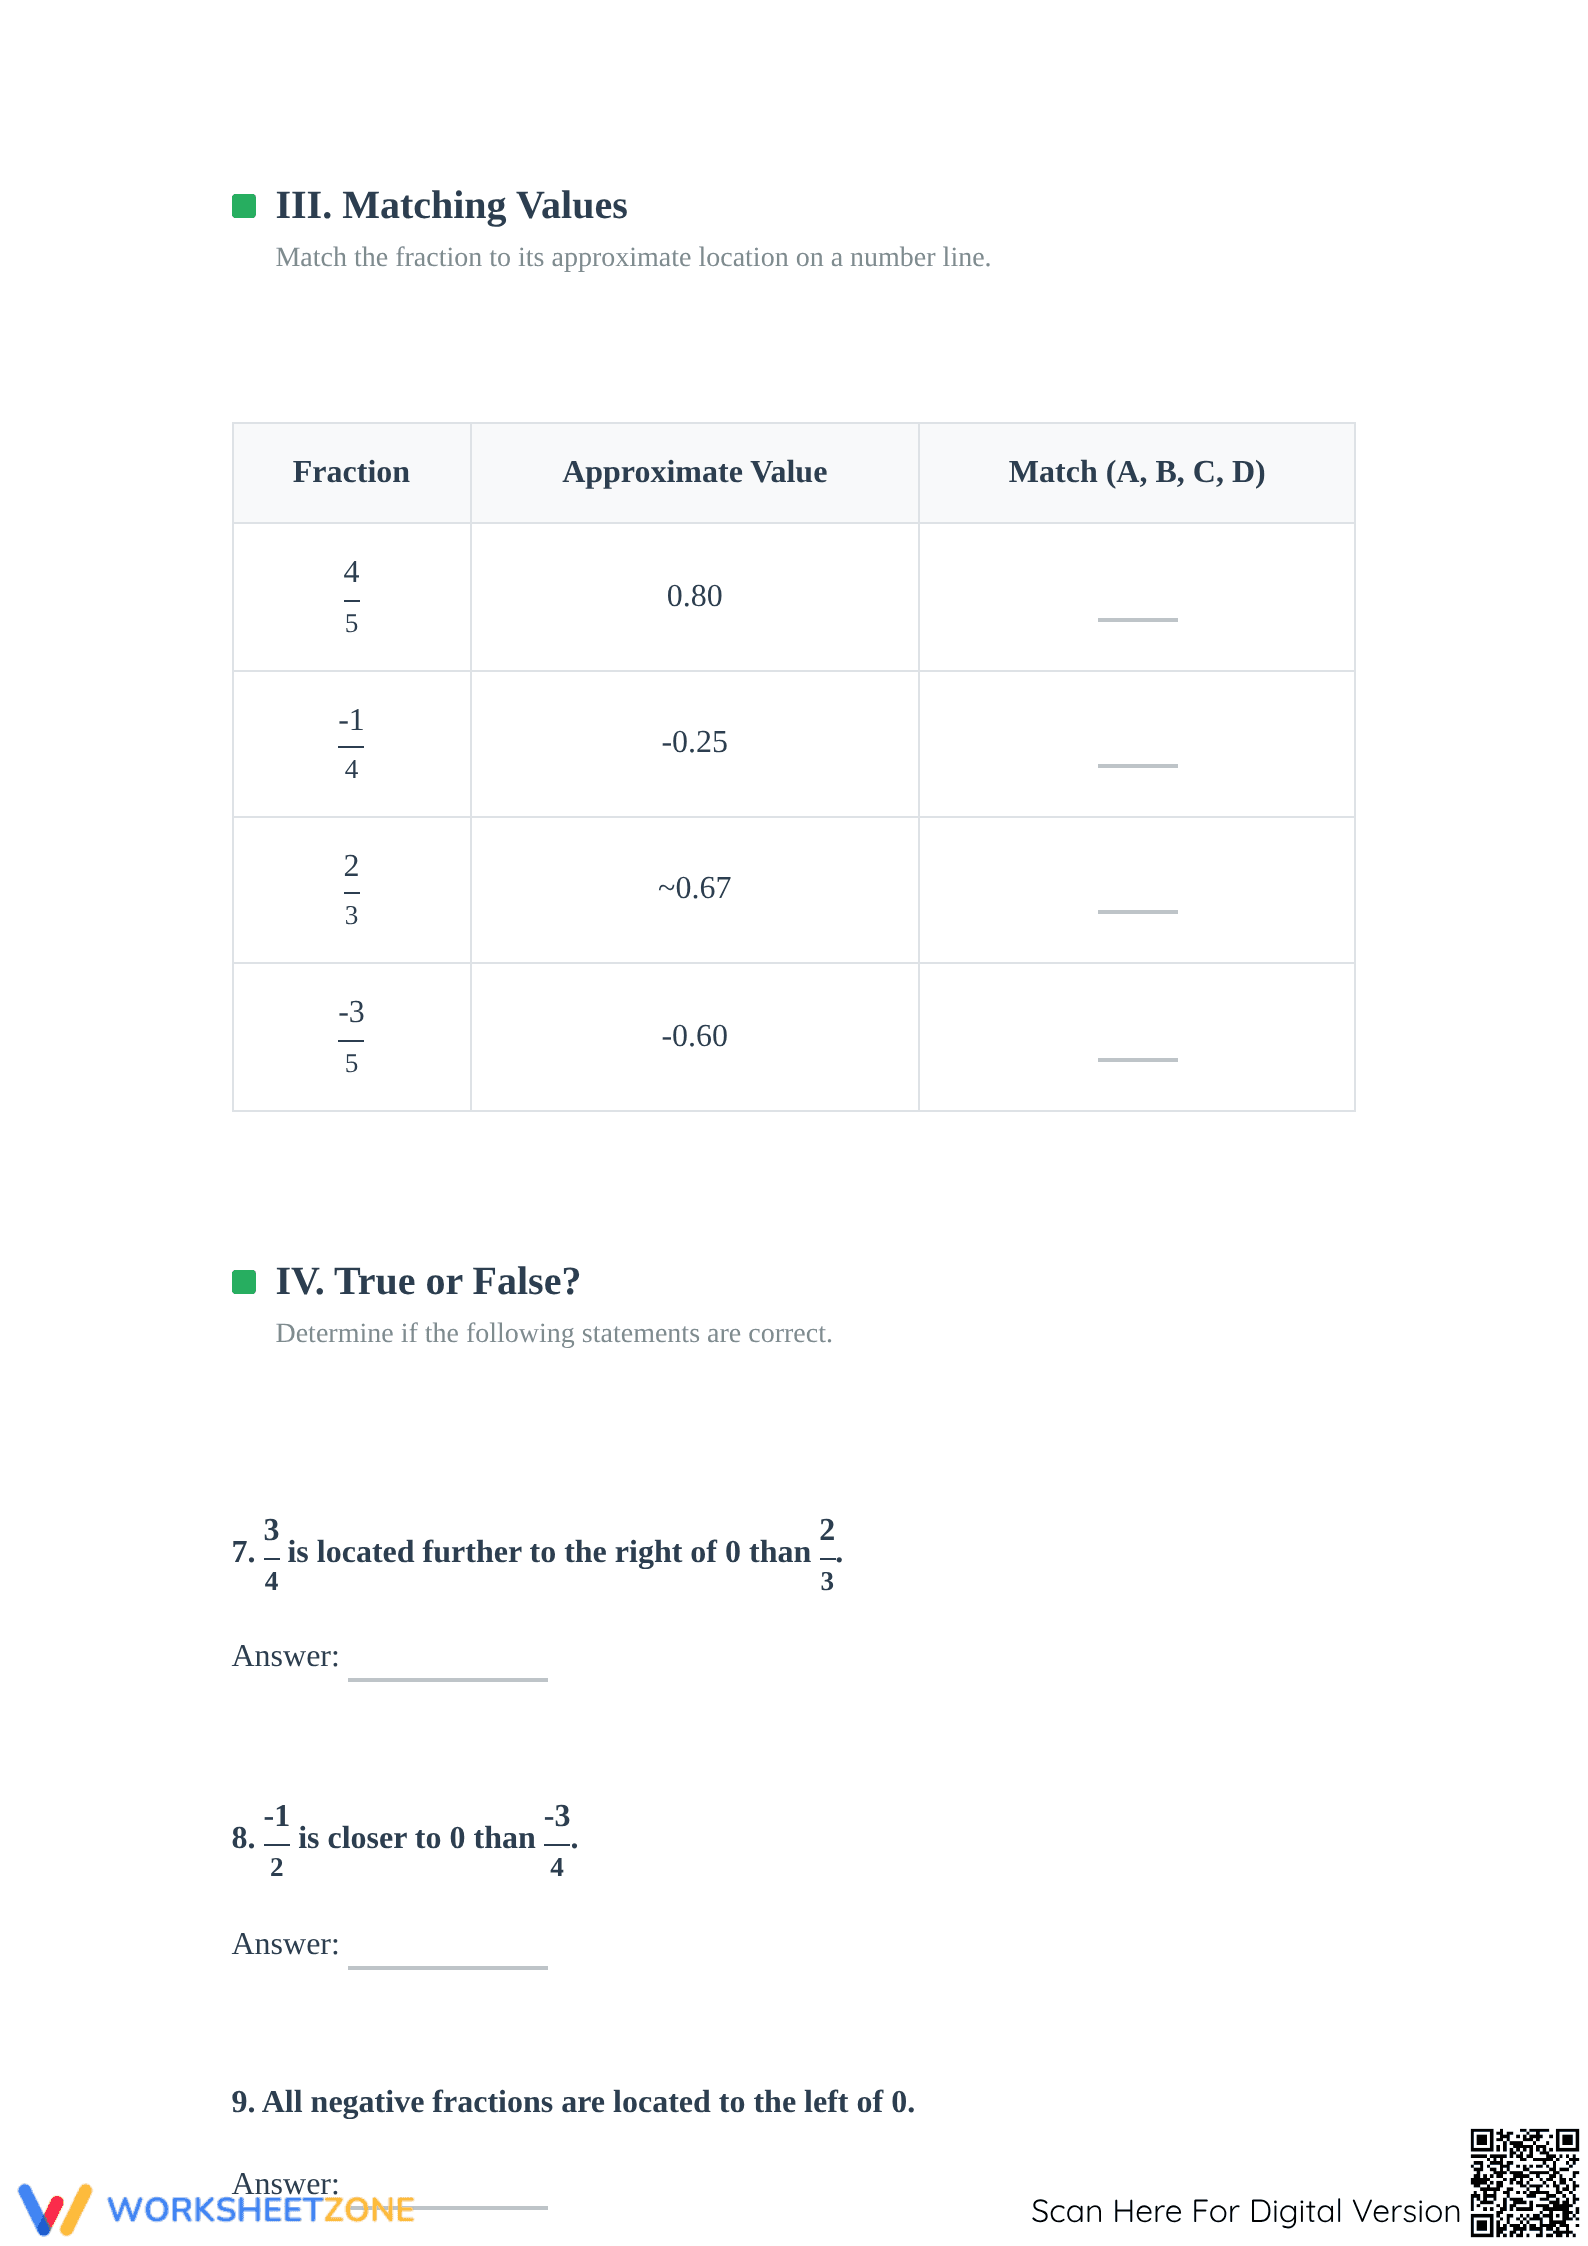
This four-page PDF features four sections to scaffold mastery. Students plot fractions on calibrated lines, perform ascending and descending ordering, match fractions to decimal approximations, and answer conceptual True/False questions. The package includes a full answer key and a reflection prompt to ensure students understand that fractions are distinct points on a mathematical continuum.
Skill Progression
- Guided Plotting: Learners place specific fraction sets onto number lines ranging from -2 to 2, gaining immediate visual feedback on positioning and relative magnitude.
- Supported Ordering: Students arrange fractions and mixed numbers in least-to-greatest or greatest-to-least sequences without visual aids to build abstract mental models.
- Independent Analysis: Final tasks require matching fractions to decimals and evaluating relational statements regarding placement relative to zero.
This approach ensures students move seamlessly from concrete visualization to the abstract manipulation of rational numbers through a gradual-release framework.
Standards Alignment
The primary focus is CCSS.MATH.CONTENT.6.NS.C.6: "Understand a rational number as a point on the number line. Represent points on the line with negative number coordinates." It also supports Grade 4 and 5 fraction comparison standards. Both standard codes can be copied directly into lesson plans, IEP goals, or district curriculum mapping tools.
How to Use This Worksheet
Assign this resource during the independent practice phase of your lesson. Use the plotting section as a formative assessment to check directionality with negative numbers before moving to abstract ordering. Have students debate the True/False questions in pairs to strengthen mathematical reasoning and communication. Expected completion time is 35 minutes of focused work.
Who It's For
Designed for Grade 6, it also serves as remediation for older students or an enrichment challenge for Grade 5 learners. It is ideal for visual learners who benefit from physical representations of numerical space. Pair this with digital tools or anchor charts for a multi-sensory experience that reinforces the "Fractions are points" concept.
The integration of visual number lines in fraction instruction is a proven pedagogical strategy for improving student outcomes in middle school mathematics. Research from RAND AIRS 2024 highlights that visual representations of rational numbers significantly reduce the "whole number bias" where students incorrectly apply integer rules to fractions. By requiring students to plot values on a line ranging from -2 to 2, this worksheet forces a confrontation with magnitude and directionality that abstract computation often misses. Fisher & Frey (2014) emphasize that the transition from plotting to ordering—as seen in the progression of this resource—is critical for the gradual release of responsibility. This Grade 6 aligned activity meets the CCSS.MATH.CONTENT.6.NS.C.6 requirement by treating fractions not just as parts of a whole, but as distinct, quantifiable points on a mathematical continuum. Educators can utilize these findings to justify the use of structured, visual practice in their core curriculum.


