


























Views
Downloads
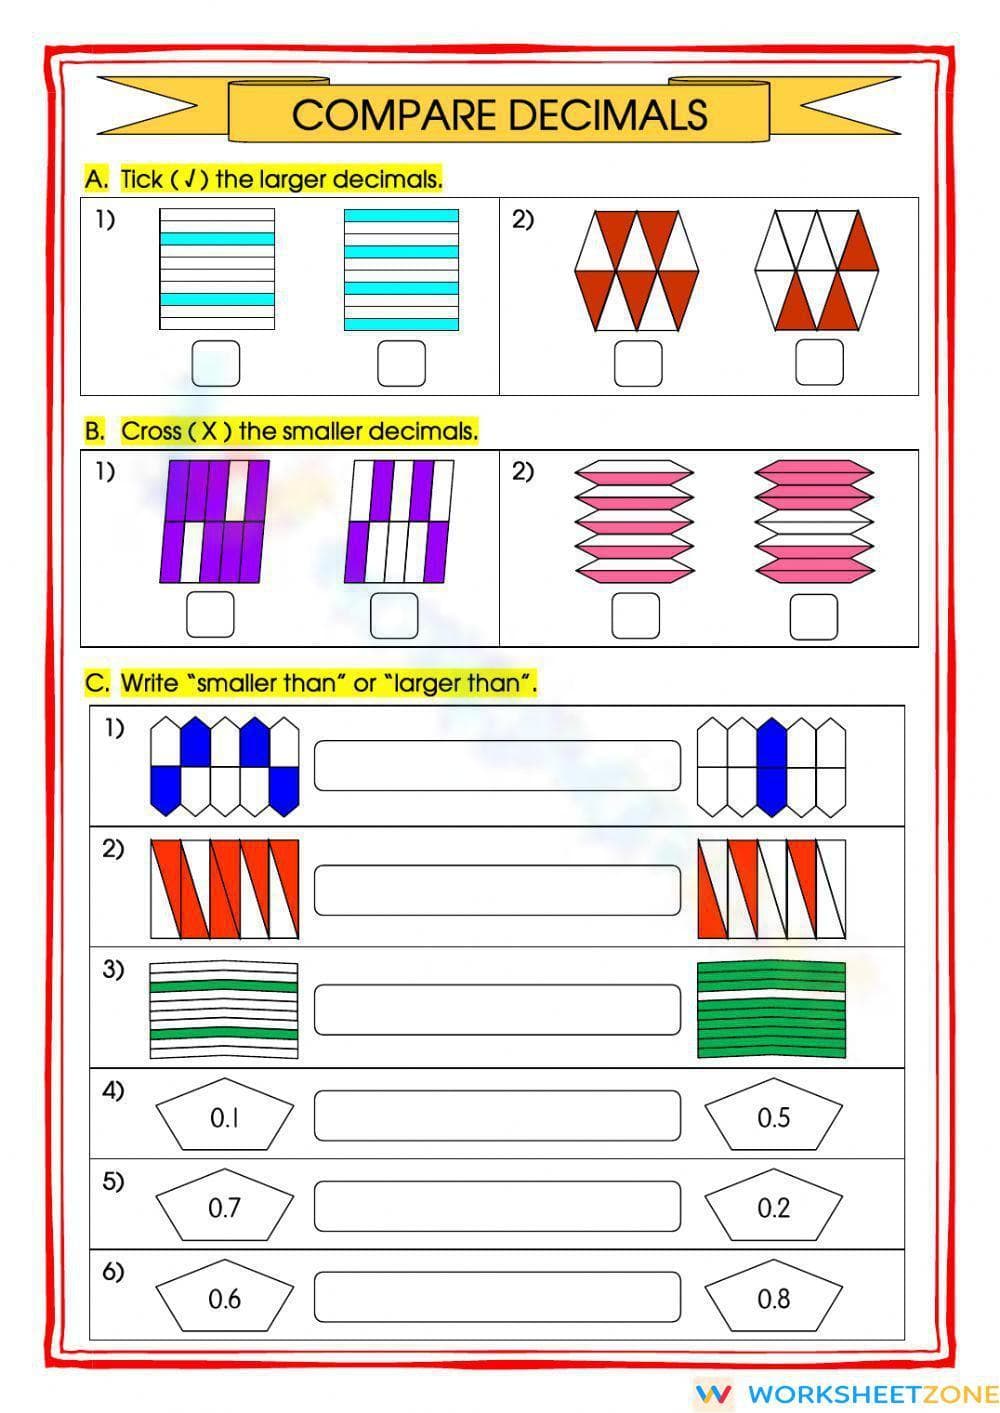

Compare Decimals Worksheet | Grade 3 Essential Math
Paste this activity's link or code into your existing LMS (Google Classroom, Canvas, Teams, Schoology, Moodle, etc.).
Students can open and work on the activity right away, with no student login required.
You'll still be able to track student progress and results from your teacher account.
This Grade 3 decimal comparison worksheet helps students visualize and compare decimal values through shaded models and numerical expressions. By identifying larger and smaller values, learners build a concrete understanding of place value and magnitude. It provides a structured path from visual recognition to abstract comparison.
At a Glance
- Grade: Grade 3 · Subject: Math
- Standard:
CCSS.MATH.CONTENT.4.NF.C.7— Compare two decimals to hundredths by reasoning about their size.- Skill Focus: Comparing Decimals
- Format: 1 page · 10 problems · Answer key included · PDF
- Best For: Introductory decimal practice and visual reinforcement.
- Time: 15–20 minutes
Inside this one-page PDF, you will find 10 targeted tasks divided into three distinct sections. The worksheet utilizes clear, shaded geometric models to represent tenths, helping students bridge the gap between fractions and decimals. It includes "tick the larger," "cross the smaller," and written comparison exercises to ensure comprehensive skill coverage.
Skill Progression
- Guided Practice: The first four problems use high-contrast visual models where students identify the larger or smaller decimal by ticking or crossing a box, reducing cognitive load.
- Supported Practice: Tasks 5-7 transition to mixed visual models where students must write out the comparison phrases "smaller than" or "larger than" to describe the relationship.
- Independent Practice: The final three problems remove visual aids entirely, requiring students to compare numerical decimals like 0.1 and 0.5 based solely on place value reasoning.
This sequence follows a gradual-release model, moving from concrete visual cues to abstract numerical fluency.
Standards Alignment
This resource aligns with `CCSS.MATH.CONTENT.4.NF.C.7`, which requires students to compare two decimals to hundredths by reasoning about their size and recognizing that comparisons are valid only when the two decimals refer to the same whole. While often a Grade 4 standard, this worksheet serves as an ideal bridge for advanced Grade 3 learners. Both standard codes can be copied directly into lesson plans, IEP goals, or district curriculum mapping tools.
How to Use It
Use this worksheet during the "You Do" phase of a lesson on decimal place value. It works exceptionally well as a formative assessment after a whole-group demonstration using base-ten blocks. Teachers should observe if students are counting individual shaded segments or recognizing the "fullness" of the model. Expected completion typically takes 15 to 20 minutes.
Who It's For
This worksheet is designed for Grade 3 students beginning their decimal journey or Grade 4 students needing a visual refresher. It is particularly effective for English Language Learners (ELLs) due to the heavy reliance on visual models. Pair this with a decimal number line or an anchor chart showing tenths and hundredths.
According to the RAND AIRS 2024 report, visual representations in early rational number instruction significantly reduce misconceptions regarding decimal magnitude. This worksheet addresses the common "longer is larger" error by providing side-by-side area models that ground abstract numbers in physical space. By mastering CCSS.MATH.CONTENT.4.NF.C.7 through visual reasoning, students develop the foundational fluency required for later operations with decimals. Research from Fisher & Frey (2014) emphasizes that scaffolding from visual to symbolic representation, as seen in these 10 tasks, ensures that students do not merely memorize procedures but understand the underlying mathematical relationships. This evidence-based approach supports long-term retention and prepares learners for the complexities of middle-school mathematics and real-world data interpretation.


