


Views
Downloads
Printable Natural Selection Patterns Chart | Grade 9 Biology
Paste this activity's link or code into your existing LMS (Google Classroom, Canvas, Teams, Schoology, Moodle, etc.).
Students can open and work on the activity right away, with no student login required.
You'll still be able to track student progress and results from your teacher account.
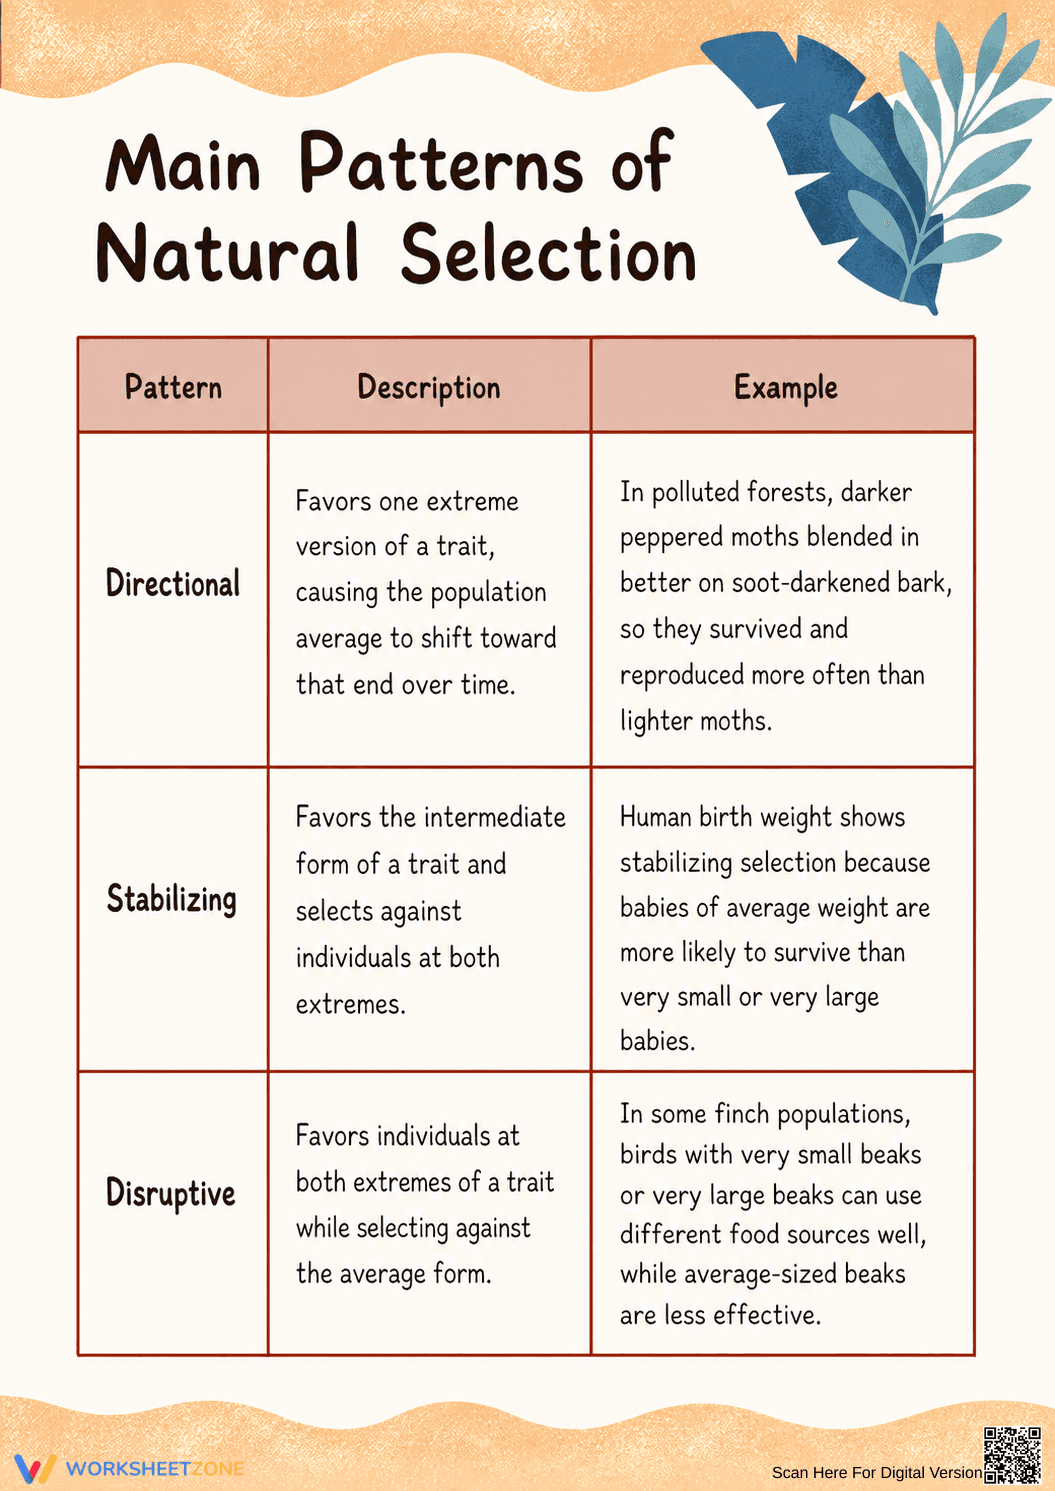
This high school biology reference chart clearly defines the three main patterns of natural selection. Students will easily grasp how environmental pressures shift population traits by reviewing directional, stabilizing, and disruptive selection. The visual layout pairs clear definitions with real-world examples to solidify foundational evolutionary concepts.
At a Glance
- Grade: 9 · Subject: Biology
- Standard:
HS-LS4-3— Explain how advantageous heritable traits increase in populations.- Skill Focus: Identifying patterns of natural selection
- Format: 1 page · 0 problems · No answer key needed · PDF
- Best For: Study guide or notebook reference
- Time: 5–10 minutes
This single-page resource features a highly organized, three-row table that breaks down complex evolutionary shifts into digestible concepts. Each row focuses on a specific pattern—directional, stabilizing, or disruptive selection—providing a concise description of how the trait is favored. Alongside the definitions, the chart includes classic biological examples, such as peppered moths, human birth weights, and finch beak variations, helping students connect theoretical genetics to observable phenomena in nature.
Integrating this chart into your lesson requires absolutely zero prep.
- Print (1 minute): Generate enough copies for your class or post the PDF directly to your digital learning platform.
- Distribute (1 minute): Hand out the charts as students enter the room or during the transition to your evolution unit.
- Review (3 minutes): Briefly walk through the three examples together to ensure students understand how to read the table.
With a total teacher prep time of under two minutes, this resource is an excellent addition to any emergency sub plan or last-minute lesson adjustment.
This material is directly aligned with HS-LS4-3, requiring students to apply concepts of statistics and probability to support explanations that organisms with an advantageous heritable trait tend to increase in proportion to organisms lacking this trait. It also supports general NGSS life science standards regarding adaptation and biological evolution. Both standard codes can be copied directly into lesson plans, IEP goals, or district curriculum mapping tools.
Introduce this chart during direct instruction as a visual anchor when explaining how environmental pressures affect population genetics. Teachers can project the PDF onto the board while students glue their own copies into interactive science notebooks. For a quick formative assessment, ask students to read a new scenario (like antibiotic resistance in bacteria) and identify which of the three patterns from the chart applies. Expect students to reference this guide frequently over a 2-to-3-week evolution unit.
This reference guide is designed for middle and high school biology students, particularly those in Grades 7 through 10. The clear, structured format provides excellent scaffolding for visual learners and students who struggle with dense textbook paragraphs. Pair this chart with a graphing activity where students plot population changes over time to reinforce the statistical nature of these evolutionary patterns.
Providing students with clear, structured visual aids significantly improves their comprehension of abstract biological processes. According to a ScienceDirect TpT Analysis, resources that organize complex data into accessible charts enhance retention and reduce cognitive load during introductory science units. This reference guide supports HS-LS4-3 by helping students explain how advantageous heritable traits increase in populations through specific selection pressures. By breaking down directional, stabilizing, and disruptive selection into distinct categories with relatable examples, educators can facilitate deeper discussions about adaptation and survival. Explicitly teaching these patterns ensures that learners can accurately interpret statistical shifts in trait distribution, a critical skill for advanced biology coursework and standardized science assessments.