


Views
Downloads
Bar Chart Interpretation Worksheet | Grade 2-4 Essential
Paste this activity's link or code into your existing LMS (Google Classroom, Canvas, Teams, Schoology, Moodle, etc.).
Students can open and work on the activity right away, with no student login required.
You'll still be able to track student progress and results from your teacher account.
This comprehensive bar chart worksheet helps elementary students master data interpretation through practical, real-world scenarios. Students analyze various charts to extract information, compare values, and solve logical problems. By engaging with visual data representations, learners build the foundational analytical skills required for mathematics. It ensures students can confidently navigate statistical information.
At a Glance
- Grade: 2-4 · Subject: Math
- Standard:
CCSS.MATH.CONTENT.3.MD.B.3— Draw and interpret scaled bar graphs to solve one- and two-step comparison problems- Skill Focus: Data Analysis & Interpretation
- Format: 5 pages · 25 problems · Answer key included · PDF
- Best For: Independent practice and formative data assessment
- Time: 30–45 minutes
What's Inside
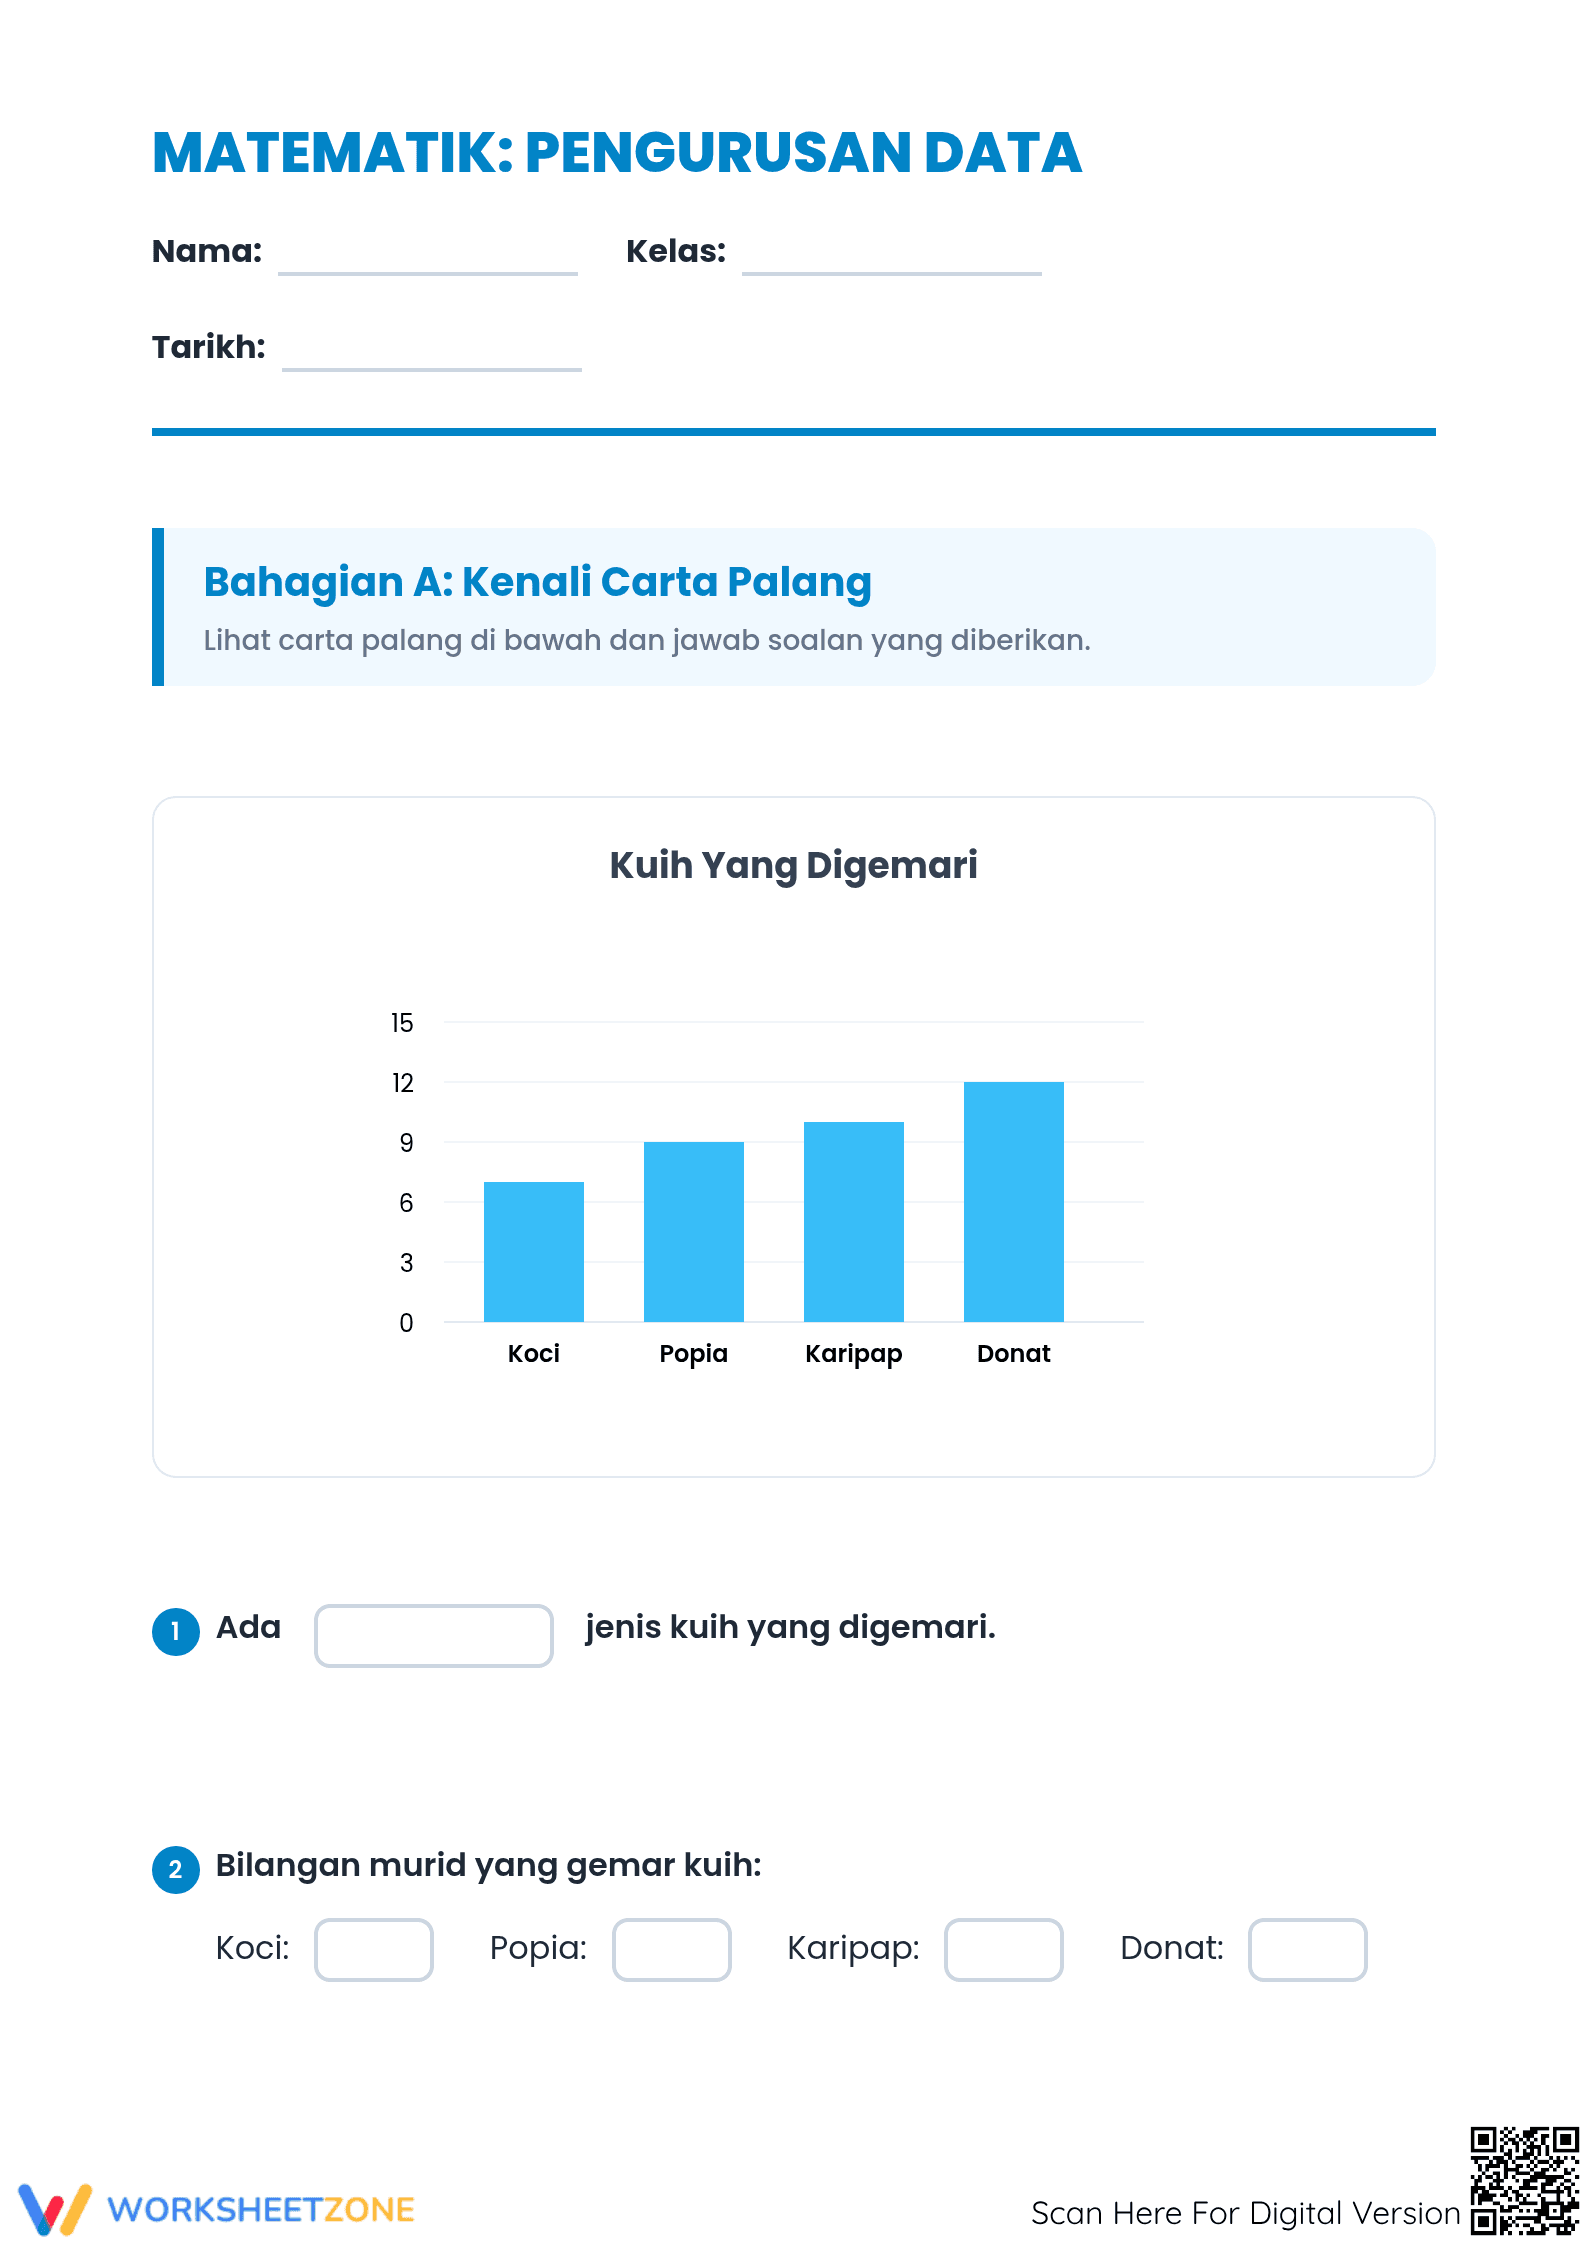
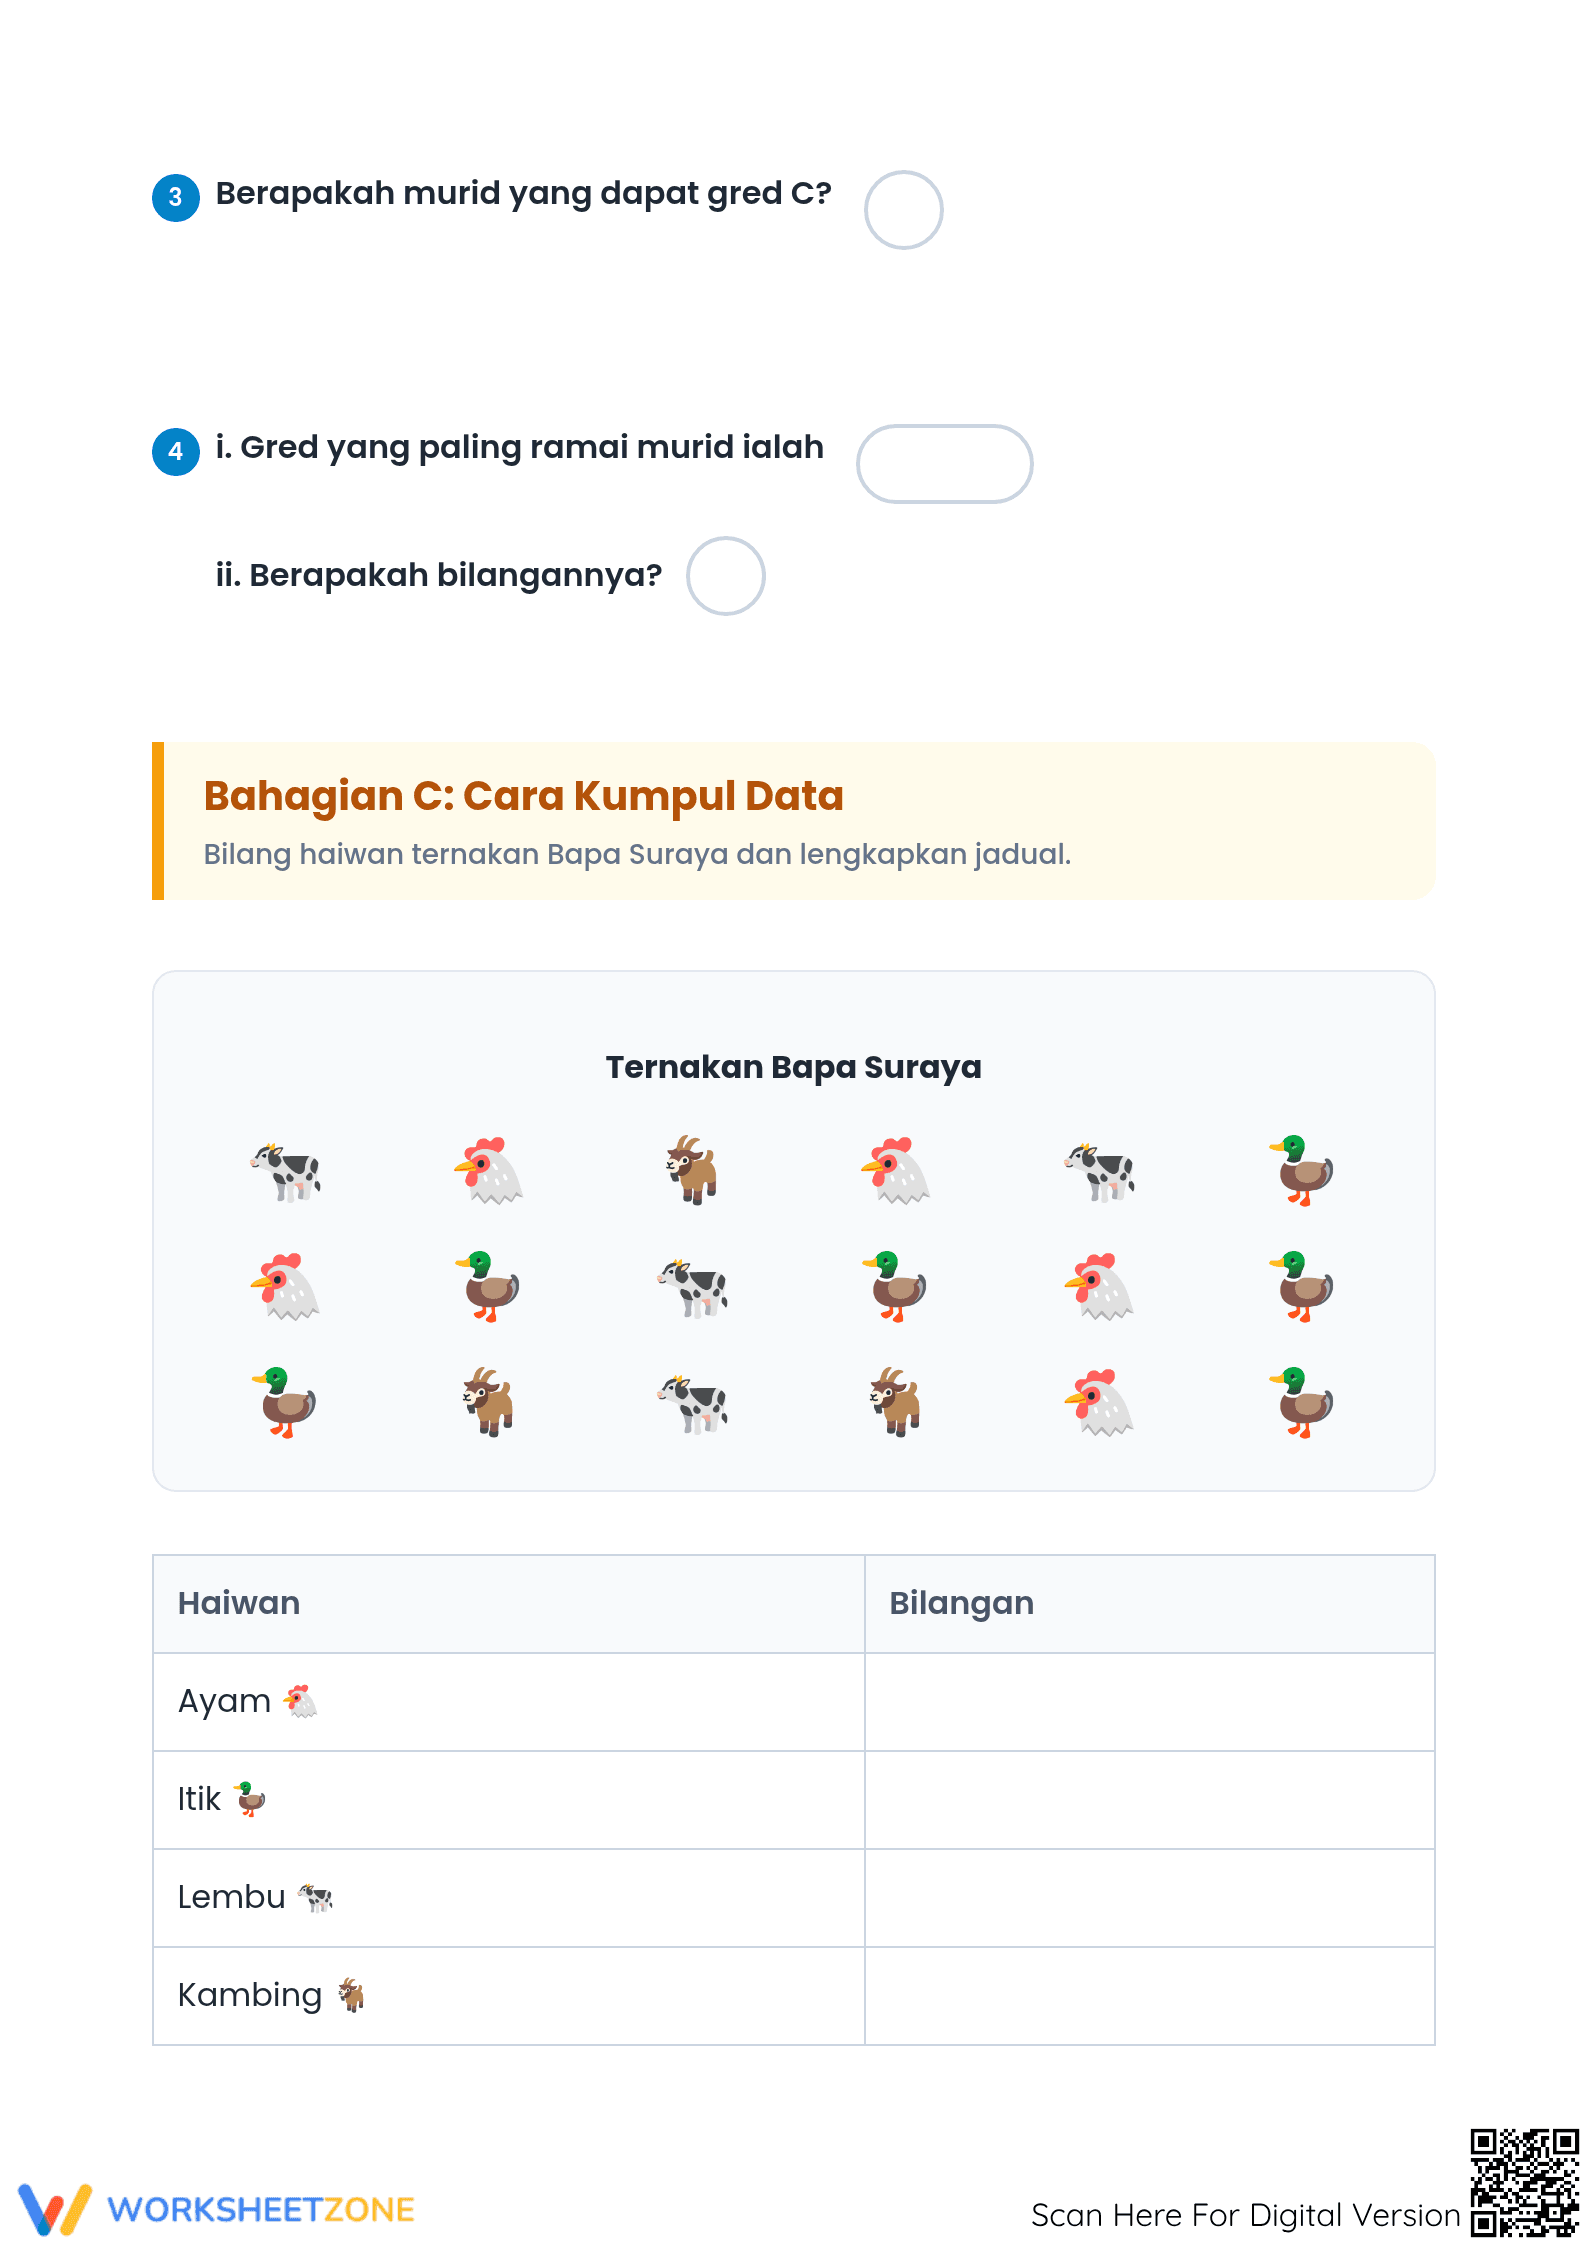
The worksheet contains five distinct pages, each centered on a different thematic bar graph: favorite foods, games, sports, pets, and fruits. With 25 total problems, the resource provides ample opportunity for repetition and mastery. Each page includes a clear visual graph followed by structured questions that require students to identify categories, determine frequencies, and perform basic arithmetic based on chart data. A complete answer key is provided for efficient grading.
Skill Progression
- Guided Practice: Identification tasks ask students to extract values directly from axes, ensuring they understand scale labels and category alignment.
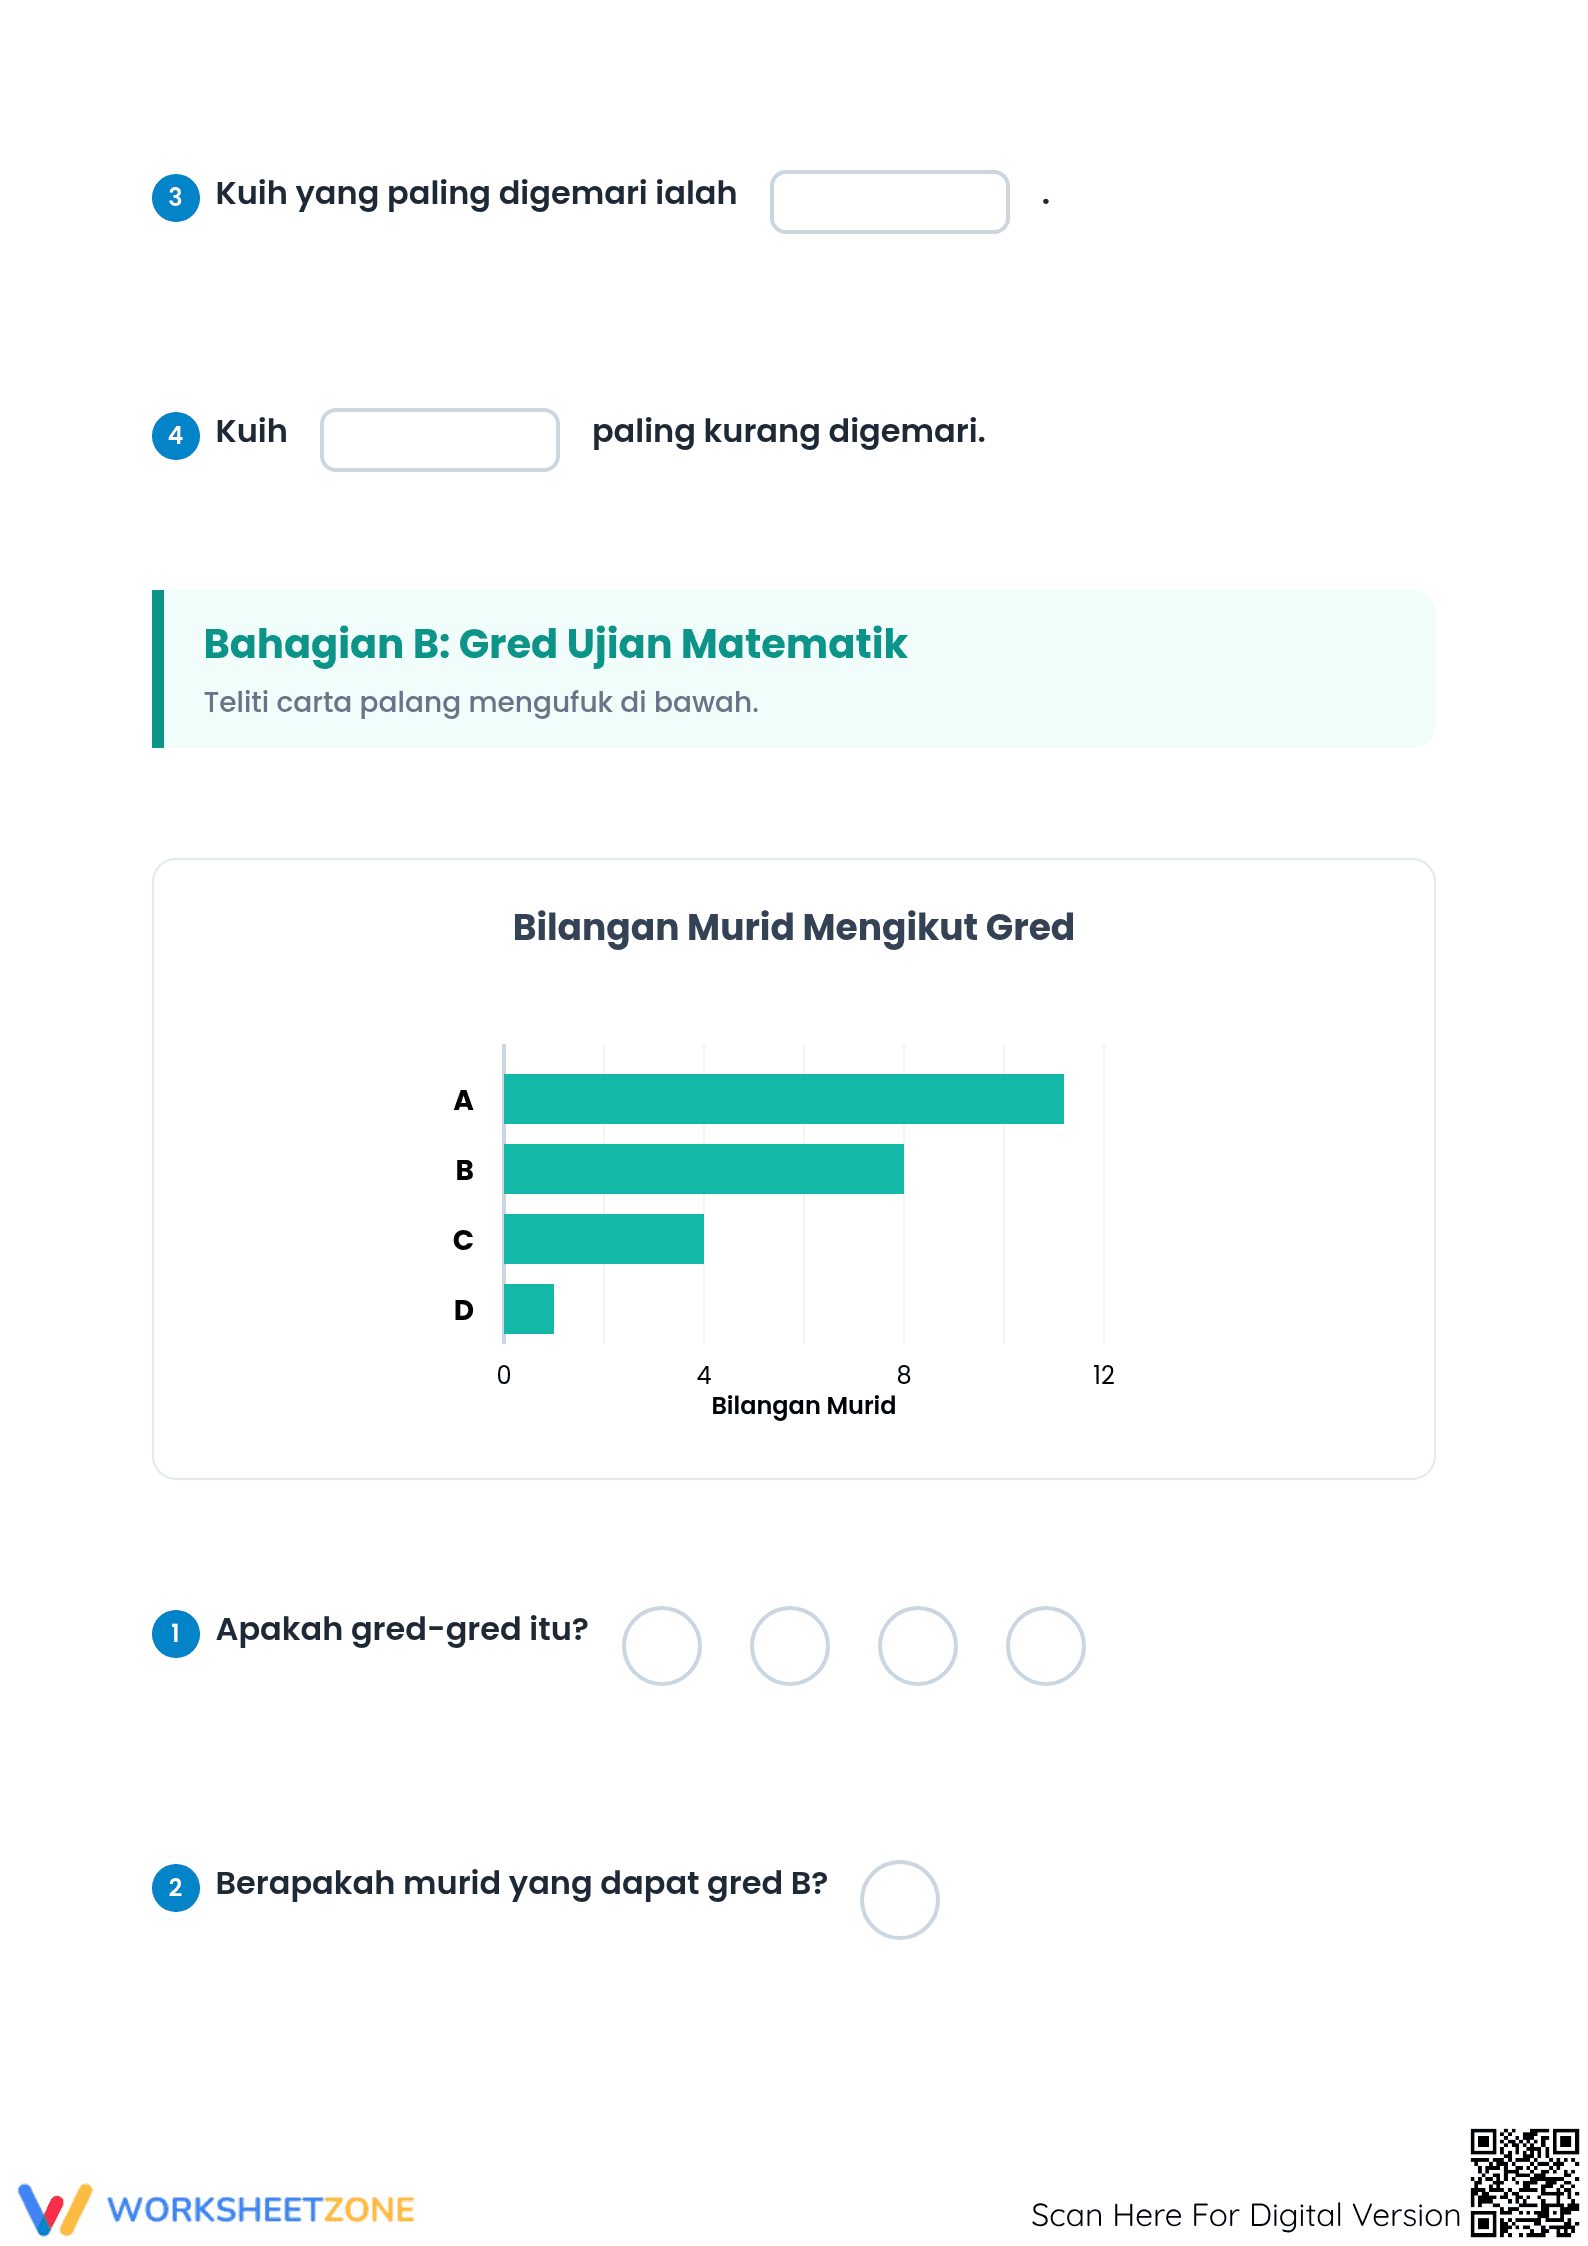
- Supported Practice: Mid-level questions introduce comparison logic, requiring students to identify the "most" or "least" popular items across categories.
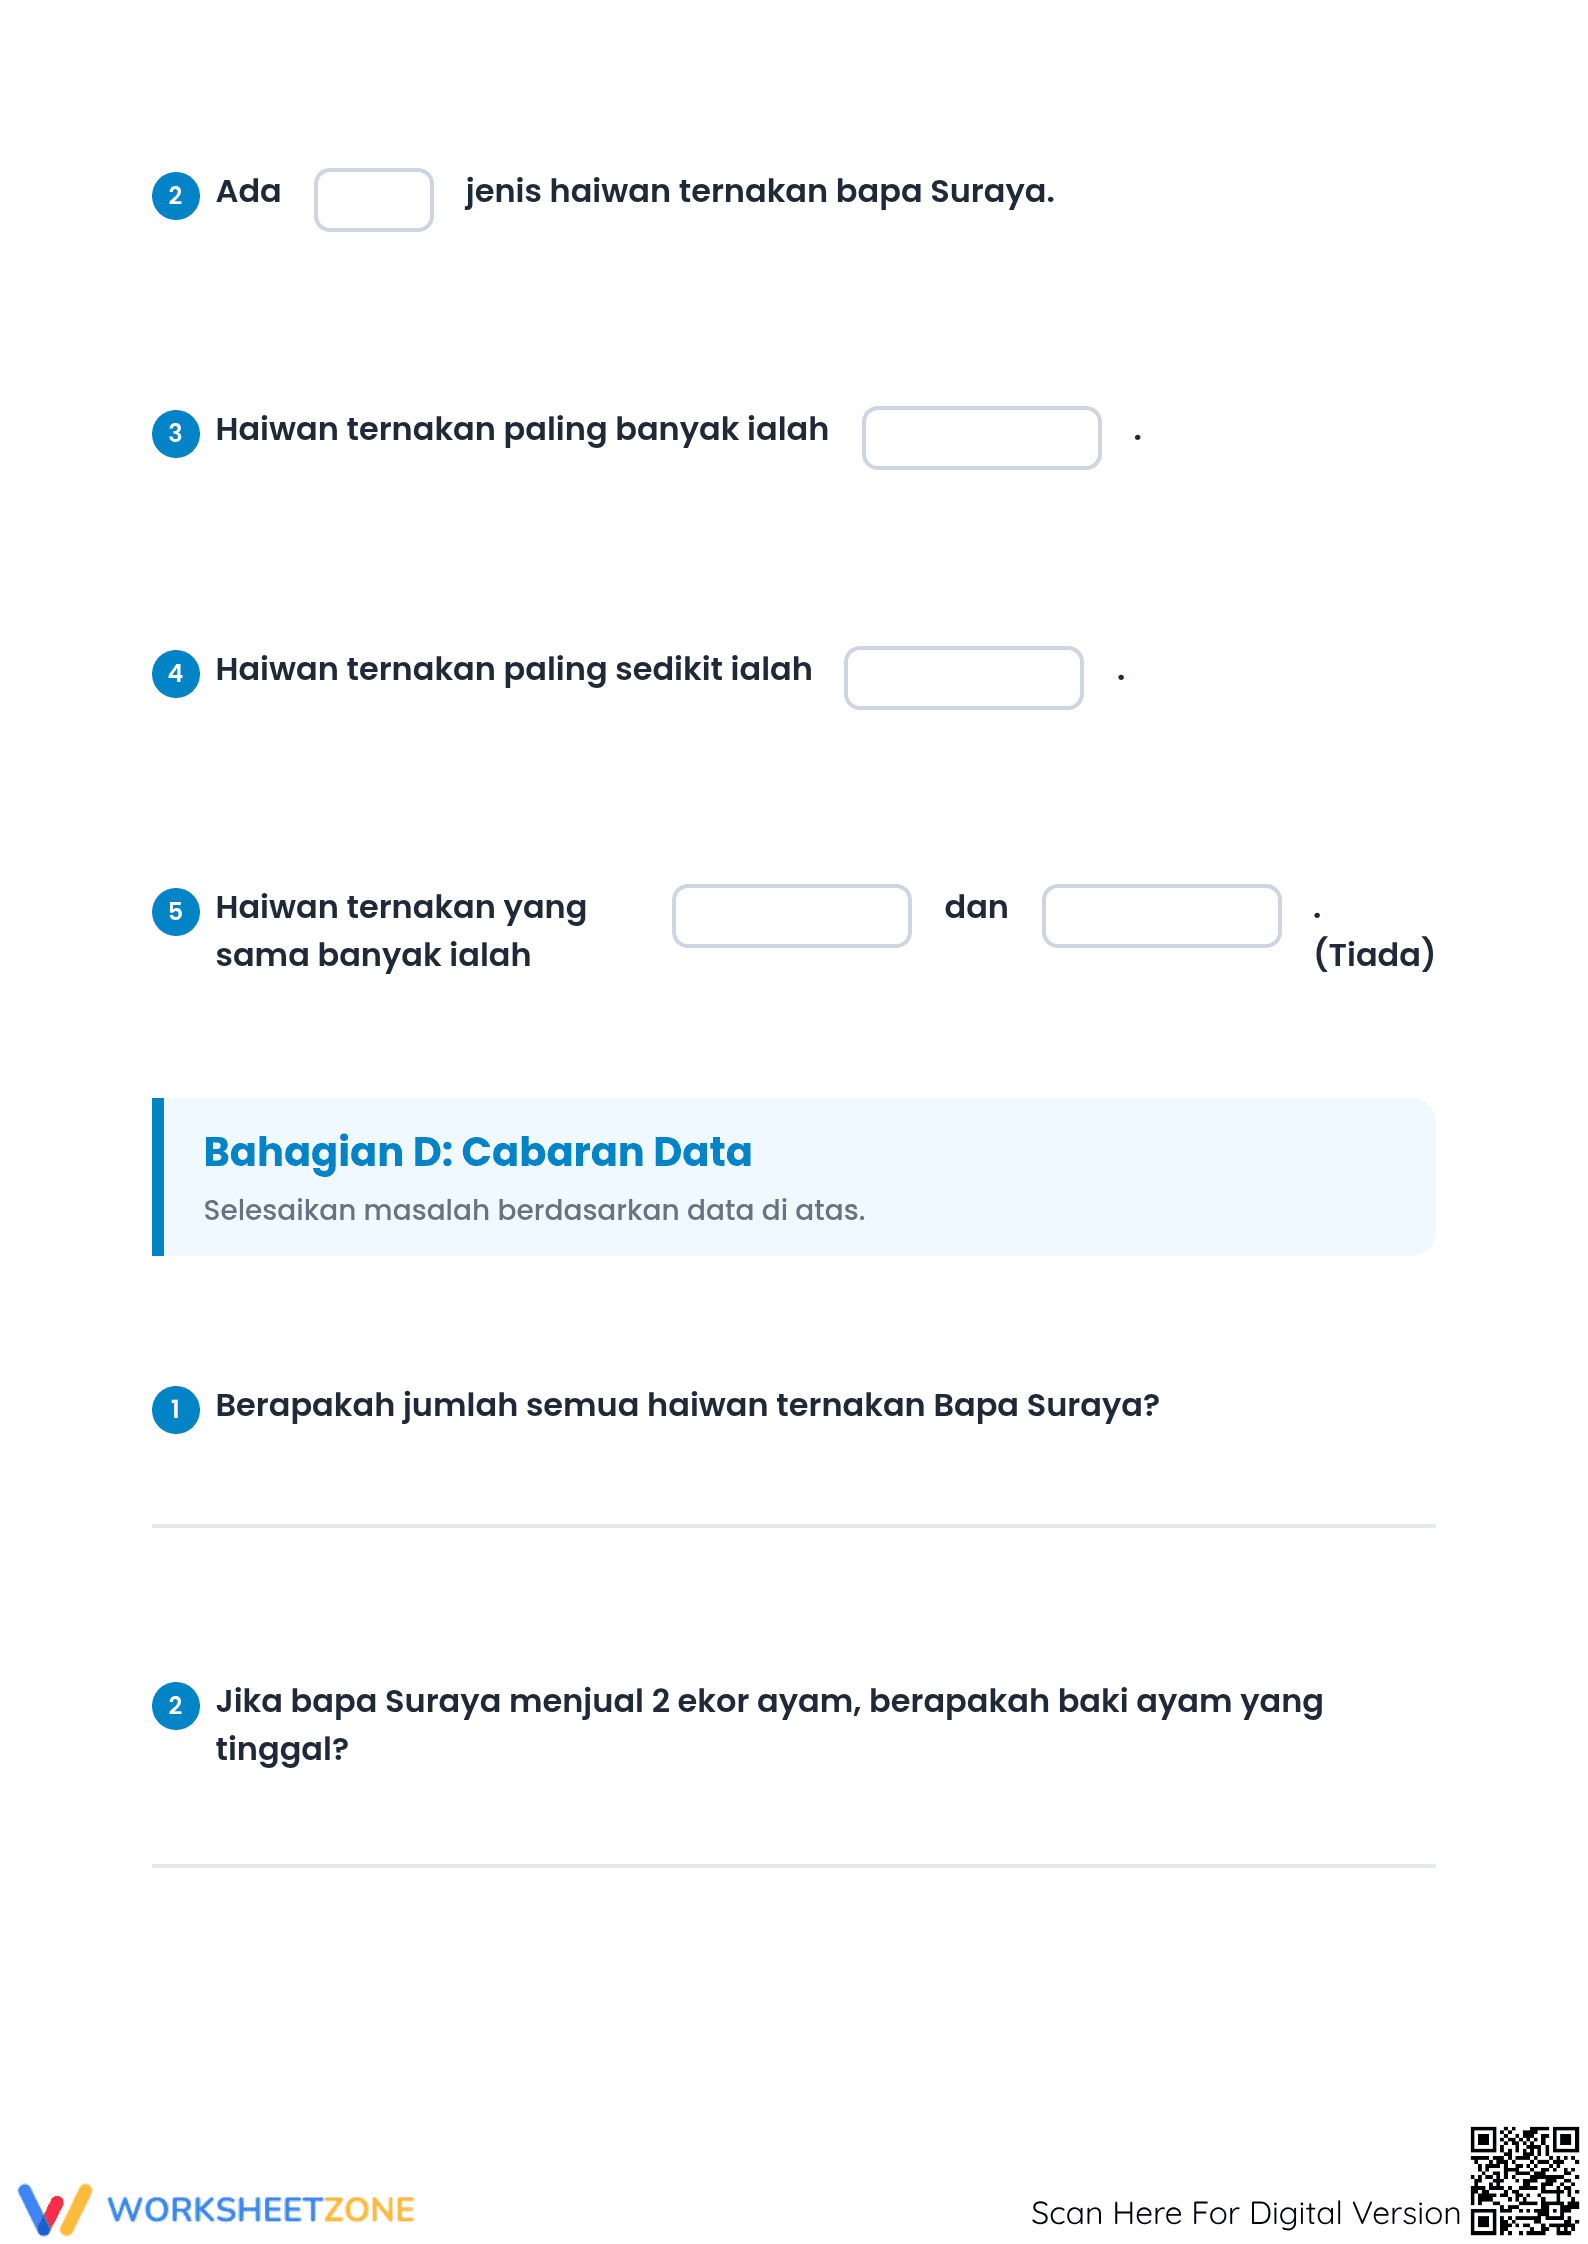
- Independent Practice: Extension problems require calculating differences between categories or aggregating total data points represented in the charts.
This structured approach follows the gradual release of responsibility model, moving students from basic decoding to complex synthesis.
Standards Alignment
This resource is explicitly aligned to `CCSS.MATH.CONTENT.3.MD.B.3`, which focuses on interpreting scaled bar graphs to solve "how many more" and "how many less" problems. The tasks also support Grade 2 and Grade 4 standards related to representational data. Both standard codes can be copied directly into lesson plans, IEP goals, or district curriculum mapping tools to ensure instructional compliance and tracking.
How to Use It
Use this resource as a post-instructional activity to verify students can apply their understanding of bar graphs independently. Teachers can observe students during completion to identify those struggling with scale intervals—a common misconception in early data education. It also serves as an excellent formative assessment tool; simply review the completed pages to determine which students require additional small-group intervention. The clear layout makes it suitable for homework or math center rotations.
Who It's For
Designed for students in Grades 2, 3, and 4, this worksheet is ideal for diverse learners needing visual scaffolds. The thematic content keeps students engaged while the consistent formatting reduces cognitive load. It pairs naturally with an introductory lesson on data collection or a classroom-wide survey activity. Teachers can differentiate by providing high-lighters to help students track lines across the graph to the vertical axis.
Mathematical literacy begins with decoding visual information, a skill directly addressed by interpreting scaled bar graphs. This worksheet provides multiple opportunities for students to interact with data representations in varied contexts, offering 25 unique problems across five pages of thematic data. The gradual release model employed here helps students move from simple identification to complex comparison, developing the stamina and precision required for the 3.MD.B.3 standard. This resource provides structured repetition for mastery, allowing educators to assess data literacy with precision and ease, making it a vital addition to any elementary math curriculum.