


0
Views
0
Downloads
0.0
0
Save
0 Likes
Interpret the Line Plot Worksheet
0 Views
0 Downloads
Paste this activity's link or code into your existing LMS (Google Classroom, Canvas, Teams, Schoology, Moodle, etc.).
Students can open and work on the activity right away, with no student login required.
You'll still be able to track student progress and results from your teacher account.
Information
Description
What It Is:
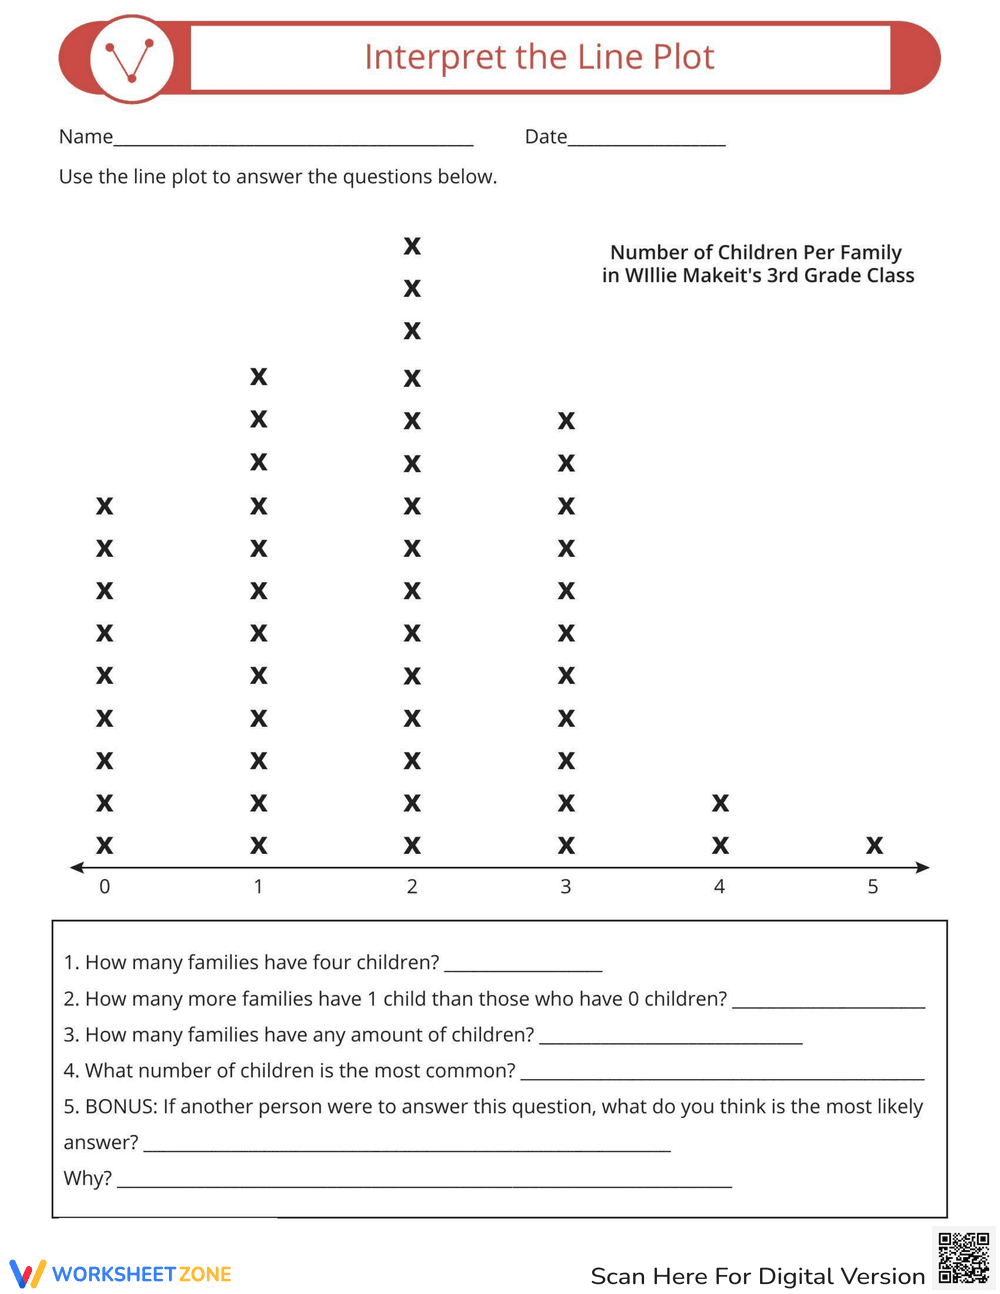
This is an educational worksheet titled 'Interpret the Line Plot.' It presents a line plot showing the number of children per family in Willie Makeit's 3rd-grade class. The x-axis represents the number of children (0 to 5), and the 'x' marks above each number indicate the frequency of families with that many children. The worksheet includes questions that require students to analyze the line plot and answer questions about the data, such as 'How many families have four children?' and a bonus question that asks for an inference.
Grade Level Suitability:
This worksheet is most suitable for 3rd grade. The title mentions 'Willie Makeit's 3rd Grade Class.' The line plot is relatively simple, and the questions are designed to assess basic data interpretation skills appropriate for this grade level.
Why Use It:
This worksheet helps students develop their data interpretation skills by analyzing a line plot. It reinforces the ability to read and understand visual representations of data, answer questions based on the data presented, and draw simple inferences. It promotes critical thinking and problem-solving skills in a real-world context.
How to Use It:
Students should first read the title and instructions. Then, they should carefully examine the line plot, noting the number of 'x' marks above each number on the x-axis. Next, they should answer each question by using the information presented in the line plot. For the bonus question, they should use their understanding of the data to make an informed guess.
Target Users:
The target users are 3rd-grade students learning about data representation and interpretation. It can also be used for students in higher grades who need a review of basic data analysis skills or for students in lower grades who are ready for a challenge.