


























Views
Downloads

Homeostasis Feedback Loops Worksheet | Grade 9-12 Printable
Paste this activity's link or code into your existing LMS (Google Classroom, Canvas, Teams, Schoology, Moodle, etc.).
Students can open and work on the activity right away, with no student login required.
You'll still be able to track student progress and results from your teacher account.
This high school biology worksheet focuses on the critical concepts of homeostasis and physiological regulation. Students will analyze real-world biological scenarios to distinguish between positive and negative feedback loops, graph patient data, and interpret the results to determine if a system is maintaining stability.
At a Glance
- Grade: 9-12 · Subject: Biology
- Standard:
HS-LS1-3— Analyze data to show how feedback mechanisms maintain stable internal conditions- Skill Focus: Identifying feedback loops and graphing data
- Format: 3 pages · 9 problems · Answer key included · PDF
- Best For: Independent practice or homework
- Time: 30–45 minutes
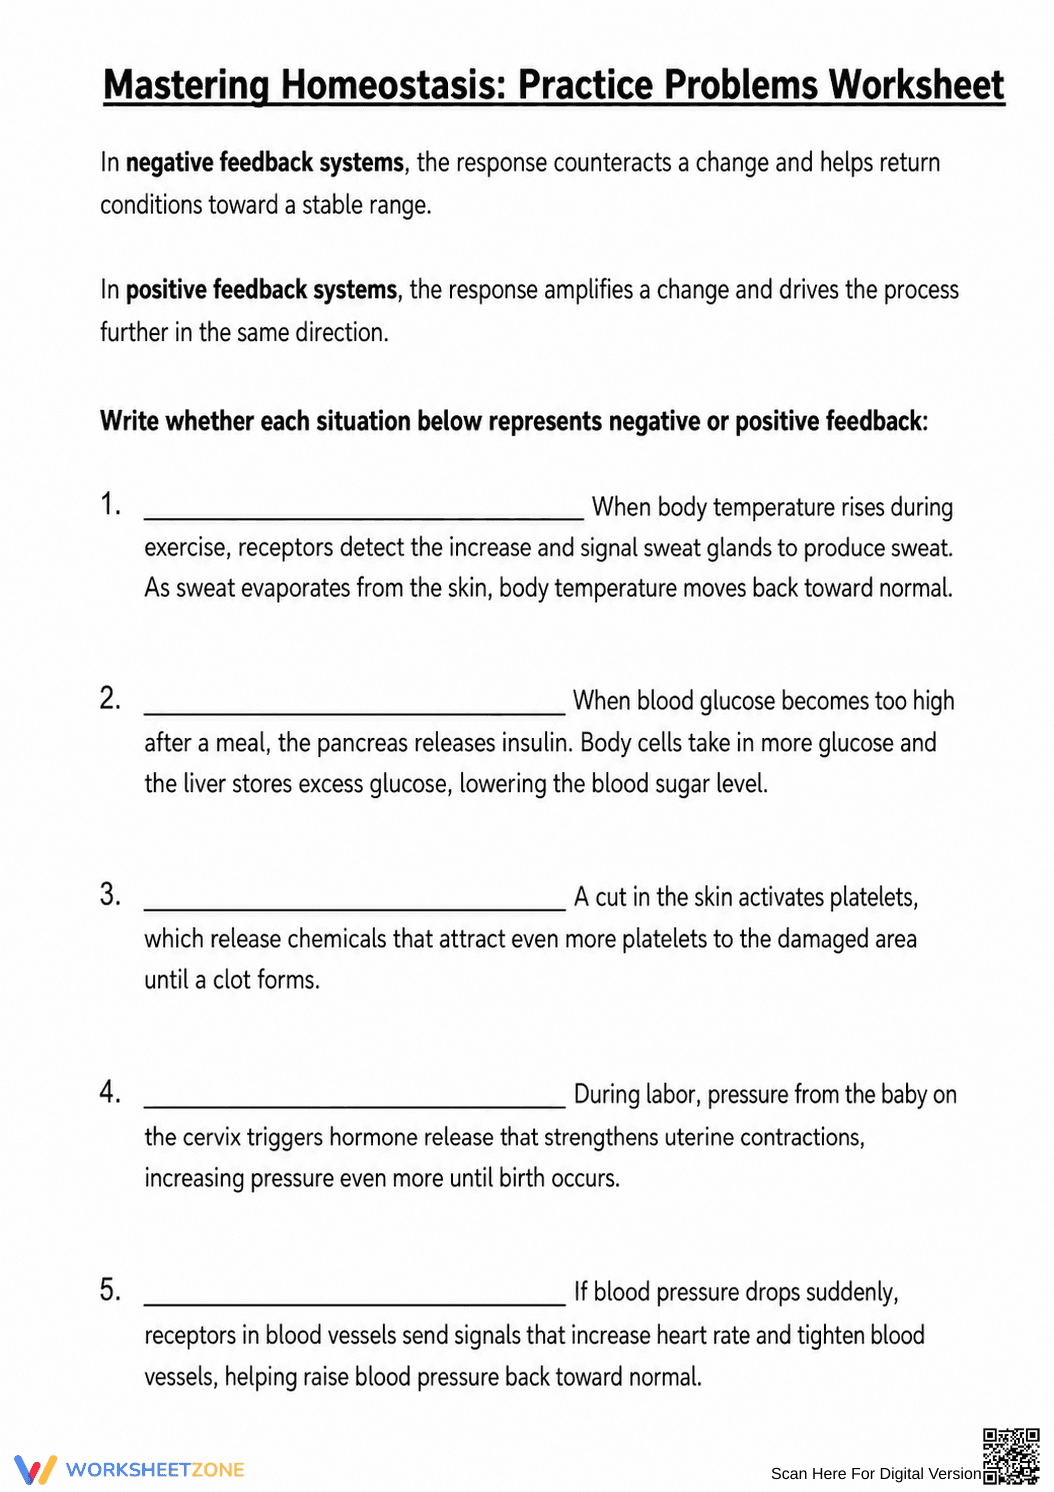
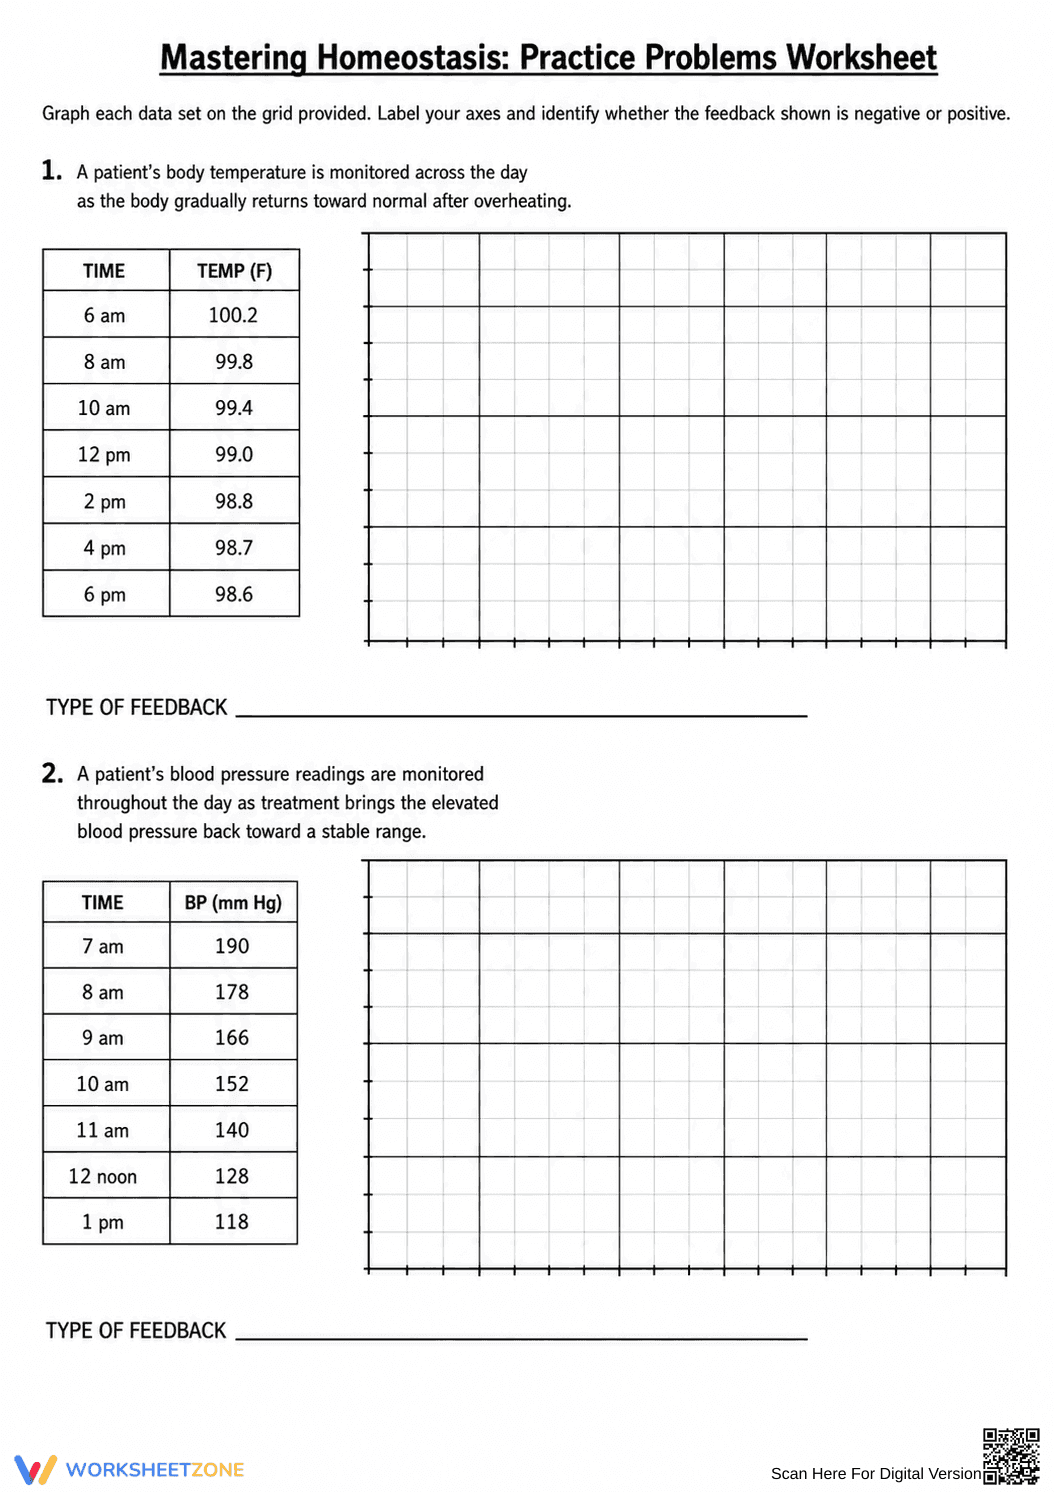
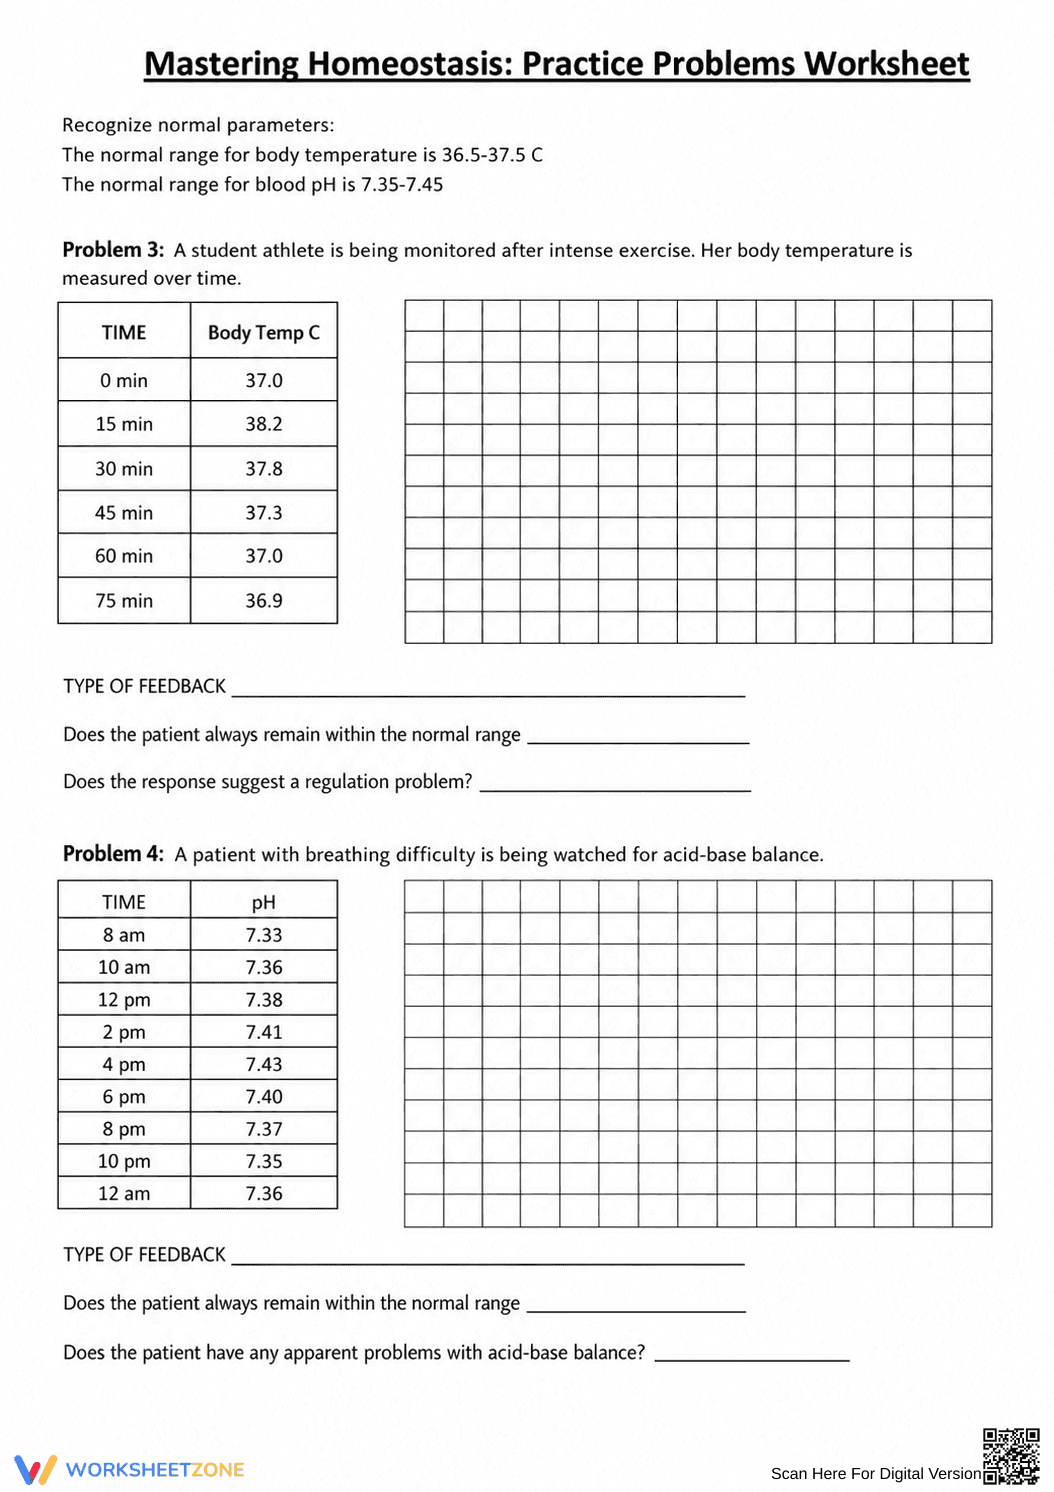
This three-page printable packet features a mix of conceptual and analytical tasks. The first section includes five real-world physiological scenarios, such as temperature regulation and childbirth, where learners must identify the feedback type. The subsequent pages provide four comprehensive data sets—covering blood pressure, body temperature, and blood pH—that require students to plot line graphs, label axes, and answer follow-up analysis questions.
- Guided practice: The worksheet begins with clear definitions of positive and negative feedback, followed by five straightforward scenario-identification questions to build foundational vocabulary.
- Supported practice: Students transition to graphing provided data sets for body temperature and blood pressure, visually connecting numerical data to the concept of a stable range.
- Independent practice: The final tasks require learners to graph complex data, identify the feedback mechanism, and independently evaluate whether the patient is experiencing a regulation problem.
This gradual-release approach ensures students confidently move from basic recall to higher-order data analysis.
Aligned to HS-LS1-3: Plan and conduct an investigation to provide evidence that feedback mechanisms maintain homeostasis. This resource specifically targets the data analysis and evidence-interpretation components of the standard. Both standard codes can be copied directly into lesson plans, IEP goals, or district curriculum mapping tools.
Post-Instruction Practice: Assign this packet after a direct instruction lesson on the human body systems and feedback loops. It serves as an excellent homework assignment or in-class independent activity.
Formative Assessment: Use the graphing sections to observe whether students can accurately plot data points and interpret the visual trends. If learners struggle to identify the stable range on their graphs, pause and review how negative feedback creates an oscillating pattern around a set point. Expected completion time is 30 to 45 minutes.
This resource is designed for high school biology, anatomy, or life science students in grades 9 through 12. For learners who need additional scaffolding, teachers can pre-label the graph axes or provide a completed example of a negative feedback graph. It pairs perfectly with an introductory anchor chart on the endocrine and nervous systems.
Mastering the concept of physiological regulation requires students to move beyond memorization and actively engage with data. Aligned with HS-LS1-3, this resource requires learners to analyze data to show how feedback mechanisms maintain stable internal conditions. According to Fisher & Frey (2014), providing students with structured, gradual-release tasks significantly improves their ability to transfer foundational knowledge to complex, real-world applications. By combining scenario identification with hands-on graphing exercises, this worksheet ensures that learners can visually and conceptually grasp how the human body responds to internal and external stimuli. The integration of mathematical plotting with biological concepts reinforces cross-disciplinary skills, making it a highly effective tool for deepening scientific literacy. This evidence-based approach supports long-term retention and prepares students for more advanced physiological studies.


