


Views
Downloads
Gummy Bear Graphing Worksheet | Essential Grade 1 Math
Paste this activity's link or code into your existing LMS (Google Classroom, Canvas, Teams, Schoology, Moodle, etc.).
Students can open and work on the activity right away, with no student login required.
You'll still be able to track student progress and results from your teacher account.
This Grade 1 Gummy Bear Graphing worksheet provides a hands-on way for students to practice data organization and representation. By sorting physical manipulatives and translating those counts into a visual bar graph, learners develop a concrete understanding of how data is collected and displayed. It transforms a simple snack into a meaningful mathematical inquiry.
At a Glance
- Grade: 1 · Subject: Math
- Standard:
CCSS.MATH.CONTENT.1.MD.C.4— Organize, represent, and interpret data with up to three categories- Skill Focus: Sorting, Tallying, and Graphing
- Format: 1 page · 2 tasks · No answer key · PDF
- Best For: Hands-on math centers and small groups
- Time: 15–20 minutes
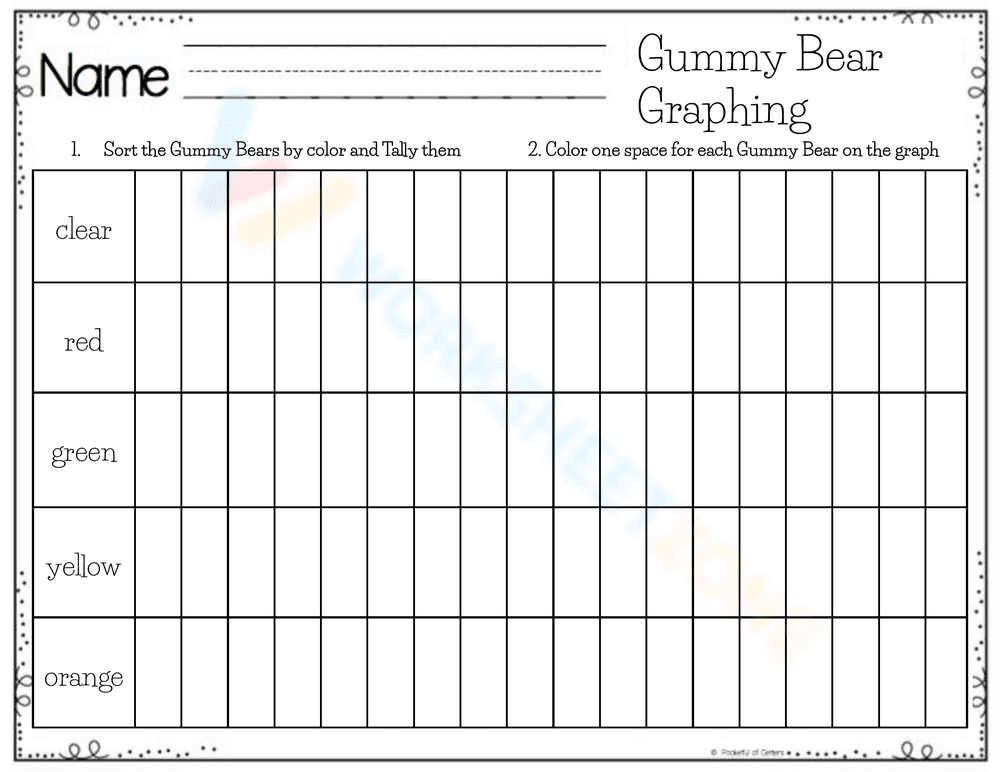
This single-page PDF features a clean, organized layout designed for young learners. It includes a designated space for student names, a two-step instruction set, and a large graphing grid. The grid is pre-labeled with five color categories: clear, red, green, yellow, and orange, allowing students to focus on the data entry rather than setup. The visual structure helps students maintain alignment while coloring their bars.
The zero-prep workflow for this activity is designed for maximum efficiency. First, print the single-page worksheet (30 seconds). Next, distribute the sheets along with a small cup of multi-colored gummy bears to each student (1 minute). Finally, review the completed graphs as a class to compare results and discuss variations in the data sets (5 minutes). This makes it an ideal choice for emergency sub plans or Friday math rotations.
The primary standard addressed is CCSS.MATH.CONTENT.1.MD.C.4, which requires students to organize, represent, and interpret data with up to three categories. While this worksheet expands to five categories, it perfectly supports the foundational skill of asking and answering questions about the total number of data points. Both standard codes can be copied directly into lesson plans, IEP goals, or district curriculum mapping tools.
Use this worksheet during the guided practice phase of a data unit. After modeling how to make a tally mark, have students work in pairs to sort their bears. It also serves as an excellent formative assessment; observe if students correctly match the bear color to the labeled row on the graph. Expected completion time ranges from 15 to 20 minutes depending on the size of the gummy bear sample provided.
This resource is ideal for first-grade students or kindergarteners ready for an extension. It is particularly effective for kinesthetic learners who benefit from moving physical objects. Pair this with a "Parts of a Graph" anchor chart to reinforce vocabulary like axis, label, and data point during the activity. It can also be used as a seasonal Valentine's Day or snack-time math activity.
According to the RAND AIRS 2024 report on early childhood numeracy, hands-on manipulatives significantly increase student engagement and retention of abstract data concepts. This worksheet leverages that principle by using familiar objects to meet CCSS.MATH.CONTENT.1.MD.C.4 requirements. By requiring students to perform the three-step process of sorting, tallying, and graphing, the activity builds a robust mental model of data representation. Research from Fisher & Frey (2014) emphasizes that such purposeful play in mathematics allows students to bridge the gap between concrete objects and symbolic representation. This 1-page resource provides the necessary structure for that transition without overwhelming the learner with complex text. It is a reliable tool for teachers seeking to integrate sensory experiences with rigorous standards-based instruction in the early elementary classroom.