


Views
Downloads


Grade 1-2 Graphs — Printable No-Prep Math Worksheet
Paste this activity's link or code into your existing LMS (Google Classroom, Canvas, Teams, Schoology, Moodle, etc.).
Students can open and work on the activity right away, with no student login required.
You'll still be able to track student progress and results from your teacher account.
This comprehensive Grade 1-2 math worksheet transforms abstract numbers into visual stories through data interpretation. Students practice reading horizontal and vertical bar graphs, analyzing weather data, and creating their own tally charts. By solving 20 structured problems, learners build the essential analytical skills needed to compare quantities and draw conclusions from real-world datasets.
At a Glance
- Grade: 1-2 · Subject: Math
- Standard:
CCSS.MATH.CONTENT.1.MD.C.4— Organize, represent, and interpret data with up to three categories and compare results.- Skill Focus: Interpreting bar graphs and data sets
- Format: 5 pages · 20 problems · Answer key included · PDF
- Best For: Independent practice or small group instruction
- Time: 30–45 minutes
What's Inside
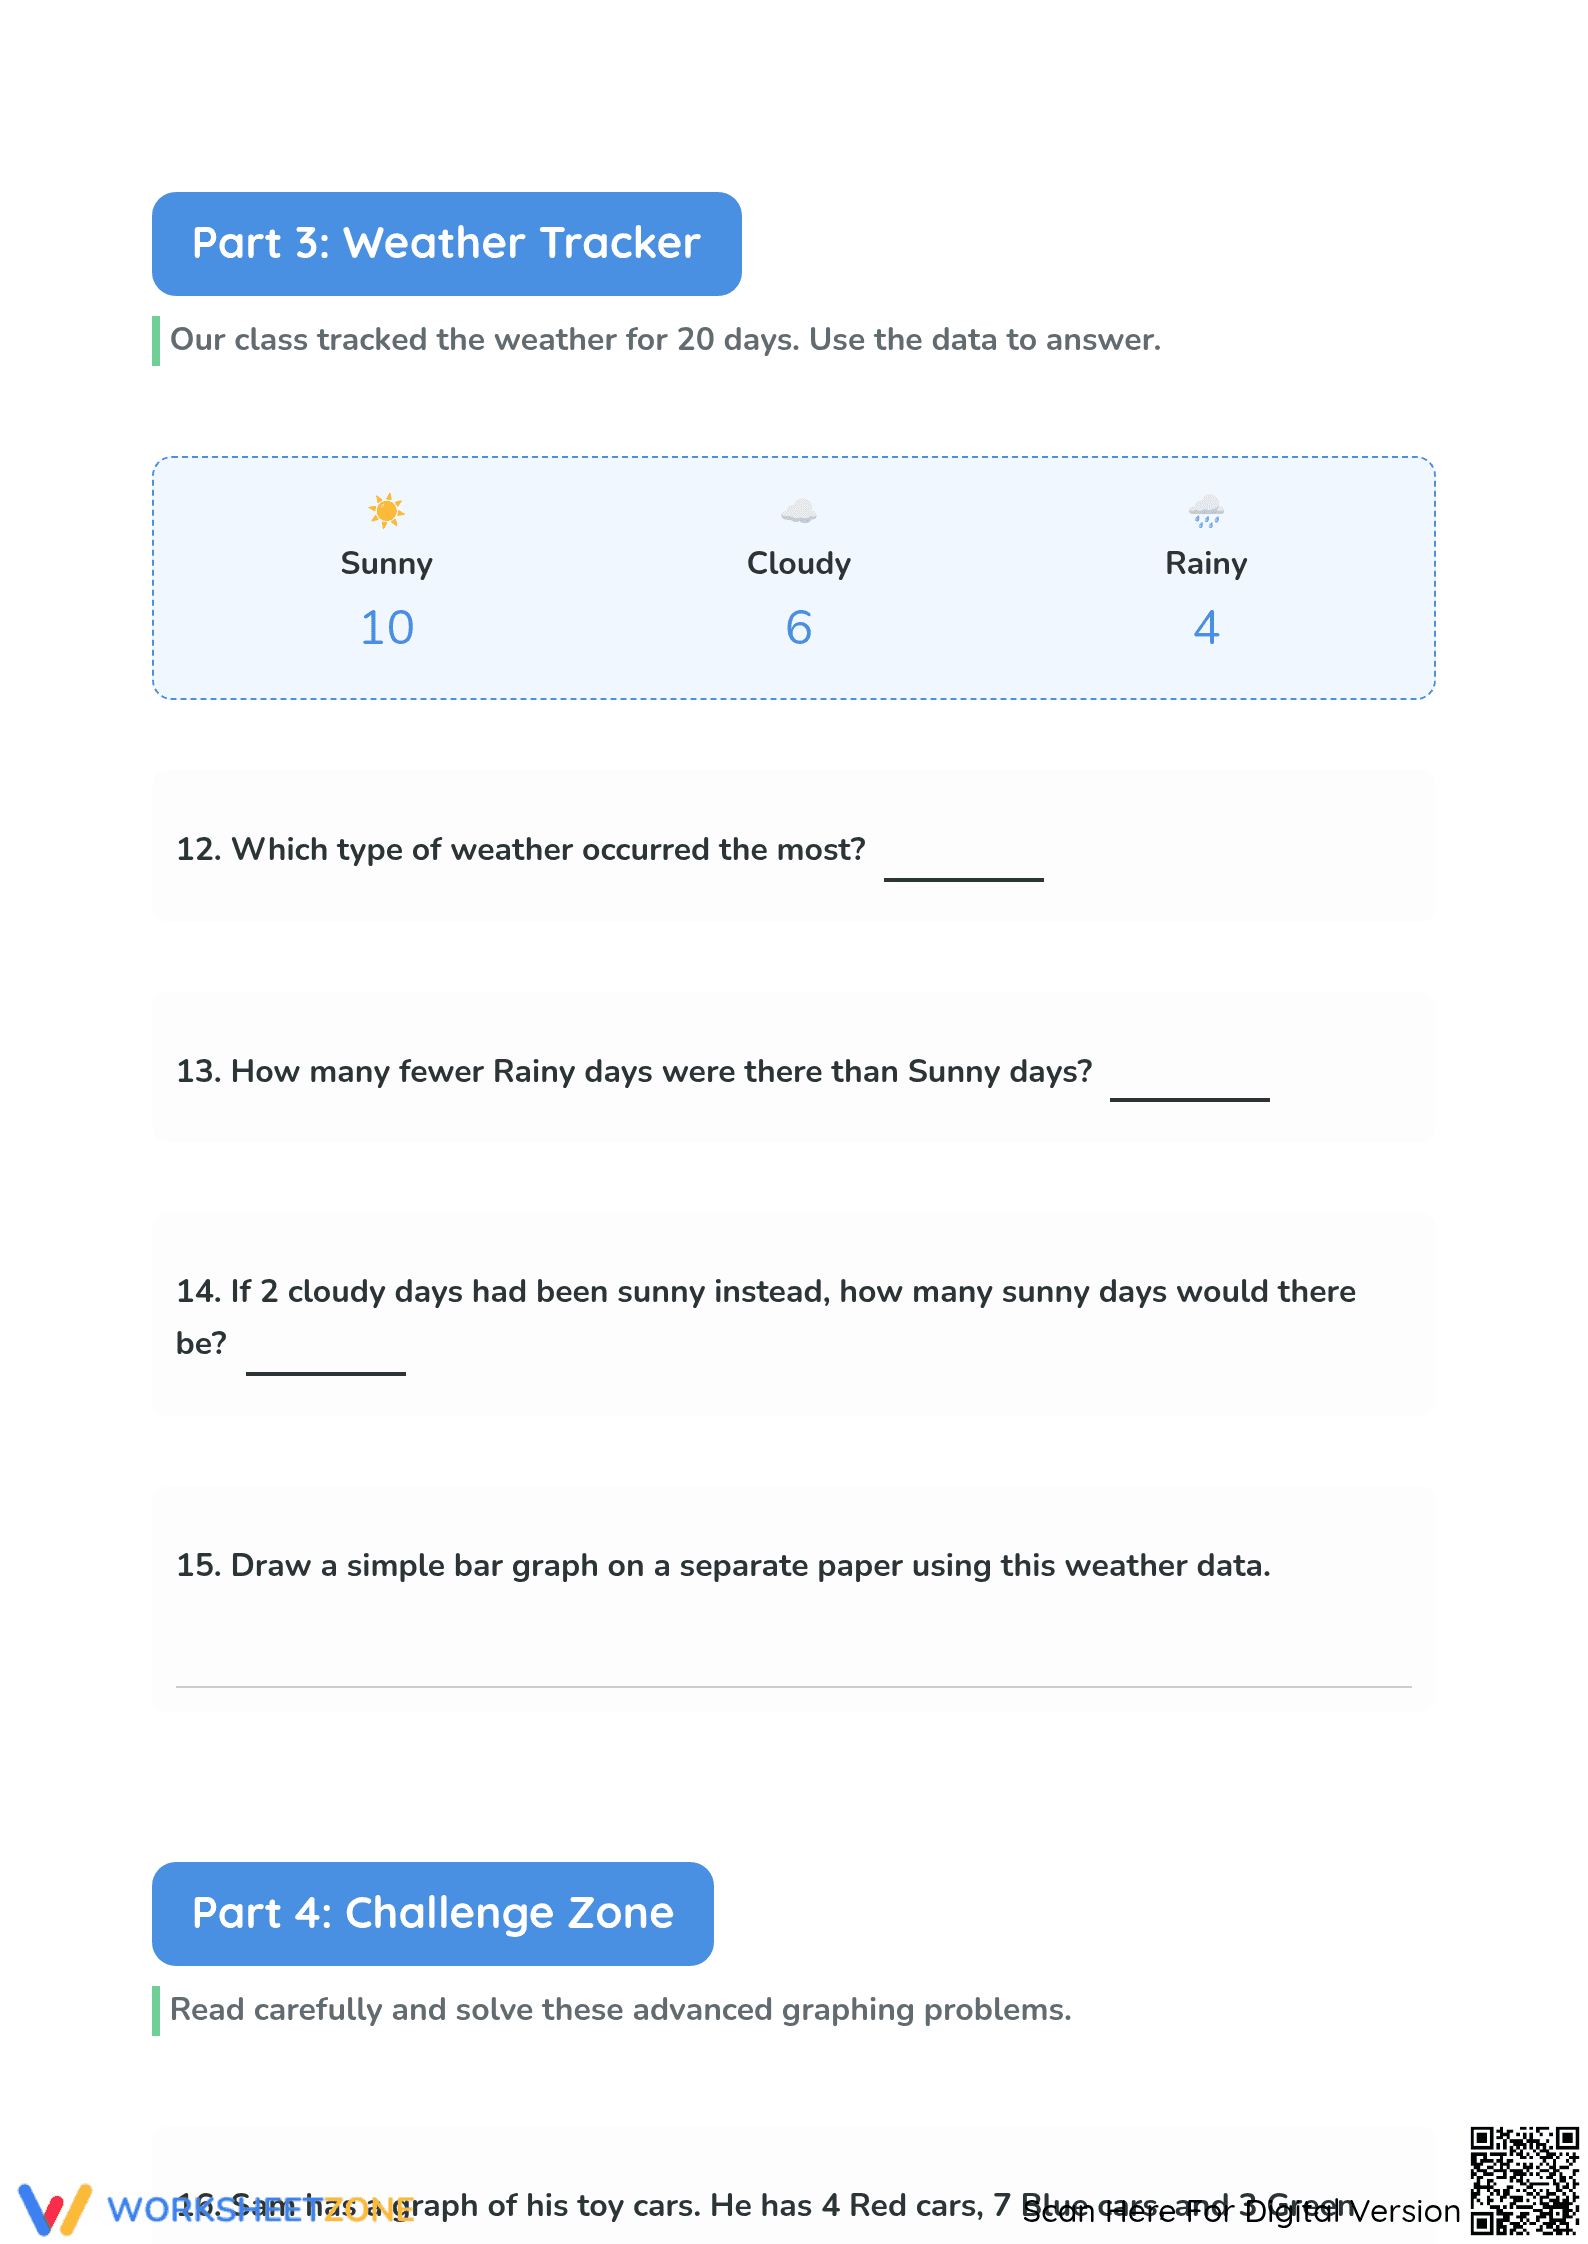
This 5-page packet is divided into five logical sections: Pet Preference, Fruit Stand Sales, Weather Tracking, a Challenge Zone, and a "Your Own Data" collection activity. It includes a mix of horizontal and vertical bar graphs, a data table for tallying, and open-ended questions. A complete answer key is provided to facilitate quick grading or self-correction.
Zero-Prep Workflow
The zero-prep workflow is designed for maximum efficiency: 1. Print the 5-page PDF packet (1 minute). 2. Distribute to students for independent math center work or assessment (1 minute). 3. Review using the included answer key for immediate feedback. Total teacher prep time is under 2 minutes, making this an excellent choice for substitute lesson plans or busy morning rotations.
Standards Alignment
Primary standard: `CCSS.MATH.CONTENT.1.MD.C.4`. This worksheet focuses on organizing, representing, and interpreting data with up to three categories. Students are required to ask and answer questions about total data points and perform comparison operations like 'how many more.' This resource also supports `CCSS.MATH.CONTENT.2.MD.D.10` by introducing simple comparison problems using information presented in bar graphs. Both standard codes can be copied directly into lesson plans, IEP goals, or district curriculum mapping tools.
How to Use It
Use this worksheet as a summative assessment after introducing basic graphing concepts to gauge student mastery of data comparison. Alternatively, assign individual sections as a morning warm-up over several days to reinforce analytical thinking. Observe if students are accurately mapping graph bars to the numerical axes to identify who needs additional visual support or scaffolding.
Who It's For
This resource is tailored for first and second-grade students developing foundational numeracy and data literacy. It provides excellent differentiation for English Language Learners through visual representations and is a natural pairing for an anchor chart on graph features or a hands-on classroom survey activity.
Effective data interpretation at the primary level is a critical precursor to advanced statistical reasoning and scientific inquiry. According to EdReports 2024, high-quality materials that bridge the gap between concrete data collection and abstract graphical representation significantly improve student retention of mathematical concepts. This worksheet aligns with research emphasizing the importance of 'gradual release' where students move from reading provided graphs to creating their own tally systems. By requiring students to calculate 'how many more' or 'how many in total,' the 20 tasks reinforce standard `CCSS.MATH.CONTENT.1.MD.C.4` through varied contexts like weather and pet preferences. Fisher & Frey (2014) highlight that such visual-to-textual transitions help young learners internalize text structures used in informational reading. This resource provides the necessary scaffolding to ensure Grade 1-2 students can confidently interpret the logic of single-unit scales and category comparisons while building the analytical stamina required for mastery of elementary data science.