


Views
Plays


Essential Graphs and Charts Worksheet | Grade 2 Math
Paste this activity's link or code into your existing LMS (Google Classroom, Canvas, Teams, Schoology, Moodle, etc.).
Students can open and work on the activity right away, with no student login required.
You'll still be able to track student progress and results from your teacher account.
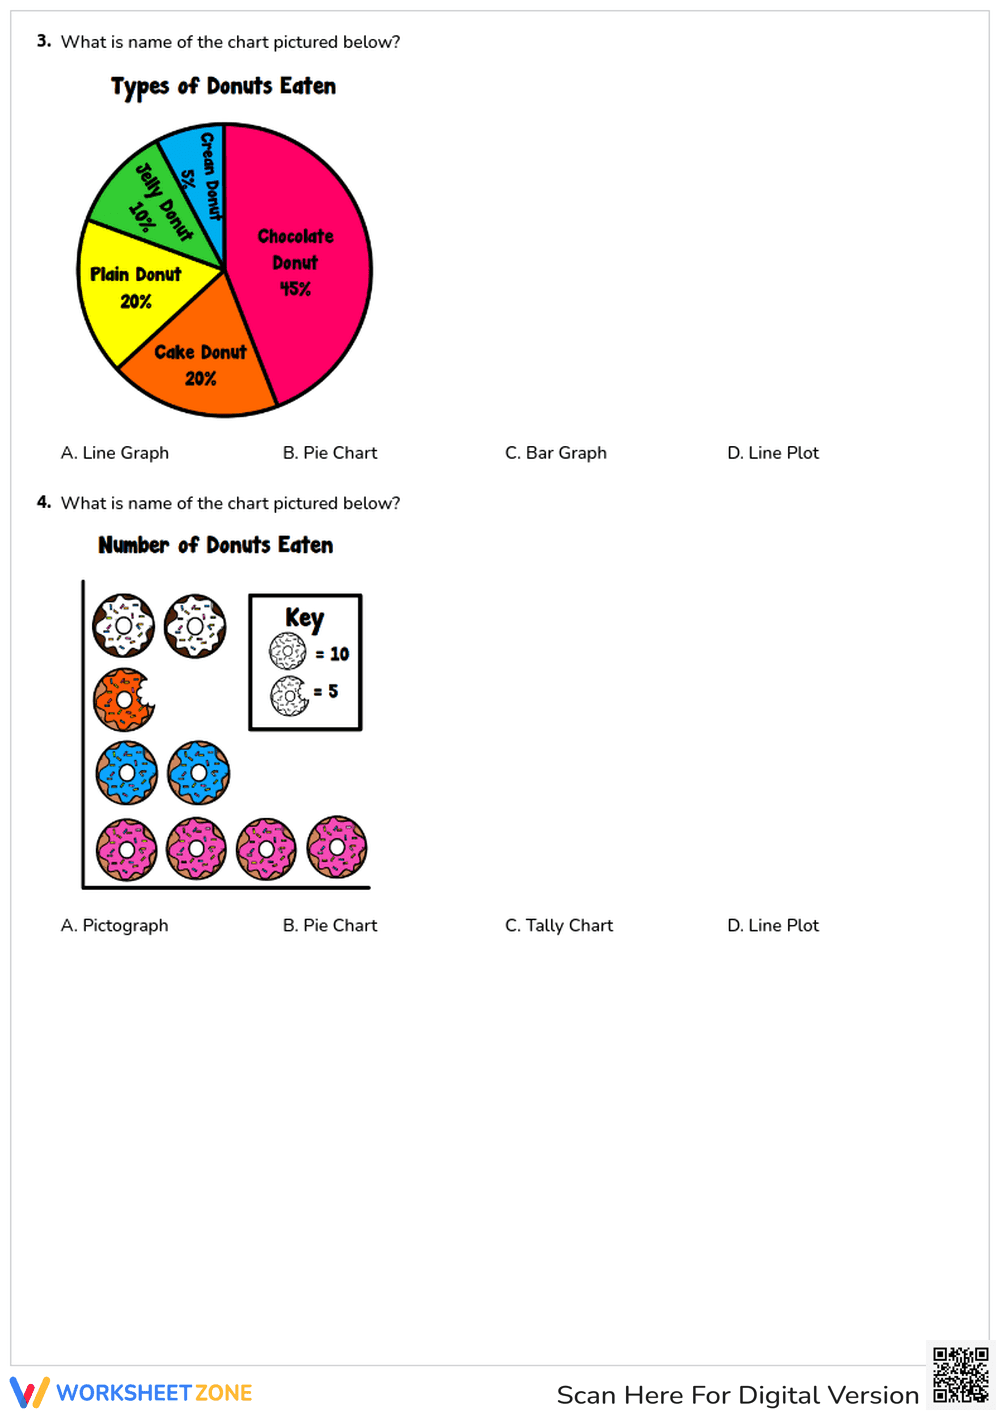
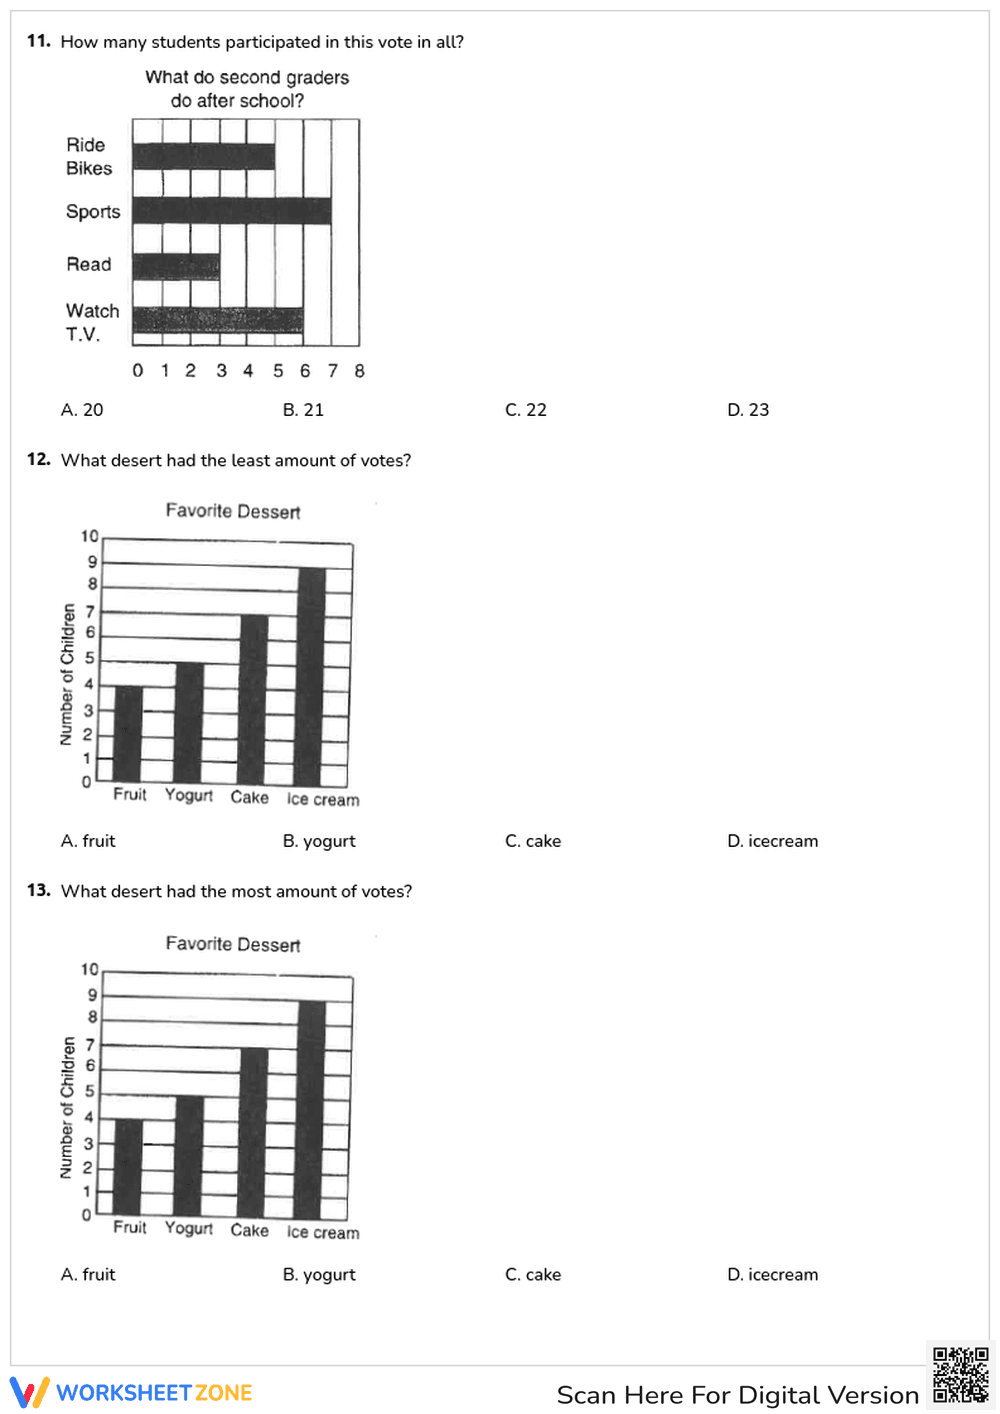
This Grade 2 math worksheet empowers students to identify and interpret various data visualizations. By engaging with 15 targeted questions, learners build fluency in reading bar graphs, line graphs, pie charts, pictographs, tally charts, and line plots. It provides a comprehensive review of data representation and analysis for early elementary mathematicians.
At a Glance
- Grade: 2 · Subject: Math
- Standard:
CCSS.MATH.CONTENT.2.MD.D.10— Draw and interpret graphs to solve simple put-together and compare problems- Skill Focus: Graph identification and data interpretation
- Format: 6 pages · 15 problems · Answer key included · PDF
- Best For: Quick formative assessment or unit review
- Time: 20–30 minutes
Inside this 6-page PDF, you will find a structured progression of tasks. The first half focuses on visual recognition, asking students to name specific chart types like tally charts and line plots. The second half transitions to data analysis, requiring students to extract specific values and perform basic addition or subtraction based on bar graph data provided in the prompts.
The zero-prep workflow is designed for busy educators. First, print the 6-page document in under 30 seconds. Second, distribute the worksheets to students for independent or small-group work, which takes about 1 minute. Finally, use the provided answer key to review student responses or facilitate a whole-class check in approximately 5 minutes. Total teacher preparation time is under 2 minutes, making it an ideal resource for tight schedules.
This resource aligns with CCSS.MATH.CONTENT.2.MD.D.10, which requires students to draw and interpret picture and bar graphs with up to four categories. It also supports CCSS.MATH.CONTENT.1.MD.C.4 by organizing and representing data. Both standard codes can be copied directly into lesson plans, IEP goals, or district curriculum mapping tools to ensure instructional compliance.
Use this worksheet as a formative assessment midway through a data unit. It works exceptionally well as a quiet activity during math centers or as a comprehensive sub plan. Observe if students can distinguish between a line plot and a line graph, as this is a common point of confusion at this grade level. Expected completion time ranges from 20 to 30 minutes depending on reading speed.
This is ideal for second-grade students mastering data standards or first graders ready for enrichment. It pairs naturally with physical manipulatives like snap cubes or a classroom anchor chart displaying different graph types. The clear font and spacious layout support students with diverse learning needs, providing enough room for students to write their calculations directly on the page.
According to the RAND AIRS 2024 report, high-quality instructional materials that integrate multiple representations of data significantly improve student retention of mathematical concepts. This worksheet addresses that need by presenting six distinct visual formats—bar graphs, line graphs, pie charts, pictographs, tally charts, and line plots—within a single 15-question set. By requiring students to both identify the format and interpret the underlying data, the resource reinforces the cognitive connection between visual structure and numerical meaning. Research from Fisher & Frey (2014) emphasizes that gradual release models, supported by clear visual cues, help students transition from basic recognition to higher-order analysis. This resource provides that scaffolded experience, ensuring students meet the rigorous demands of CCSS.MATH.CONTENT.2.MD.D.10. It serves as a reliable tool for documenting student progress toward mastery in early elementary data analysis and representation.