


1 / 4
0
Views
0
Downloads
0.0
0
Save
0 Likes
Function Worksheet
0 Views
0 Downloads
Paste this activity's link or code into your existing LMS (Google Classroom, Canvas, Teams, Schoology, Moodle, etc.).
Students can open and work on the activity right away, with no student login required.
You'll still be able to track student progress and results from your teacher account.
Information
Description
What It Is:
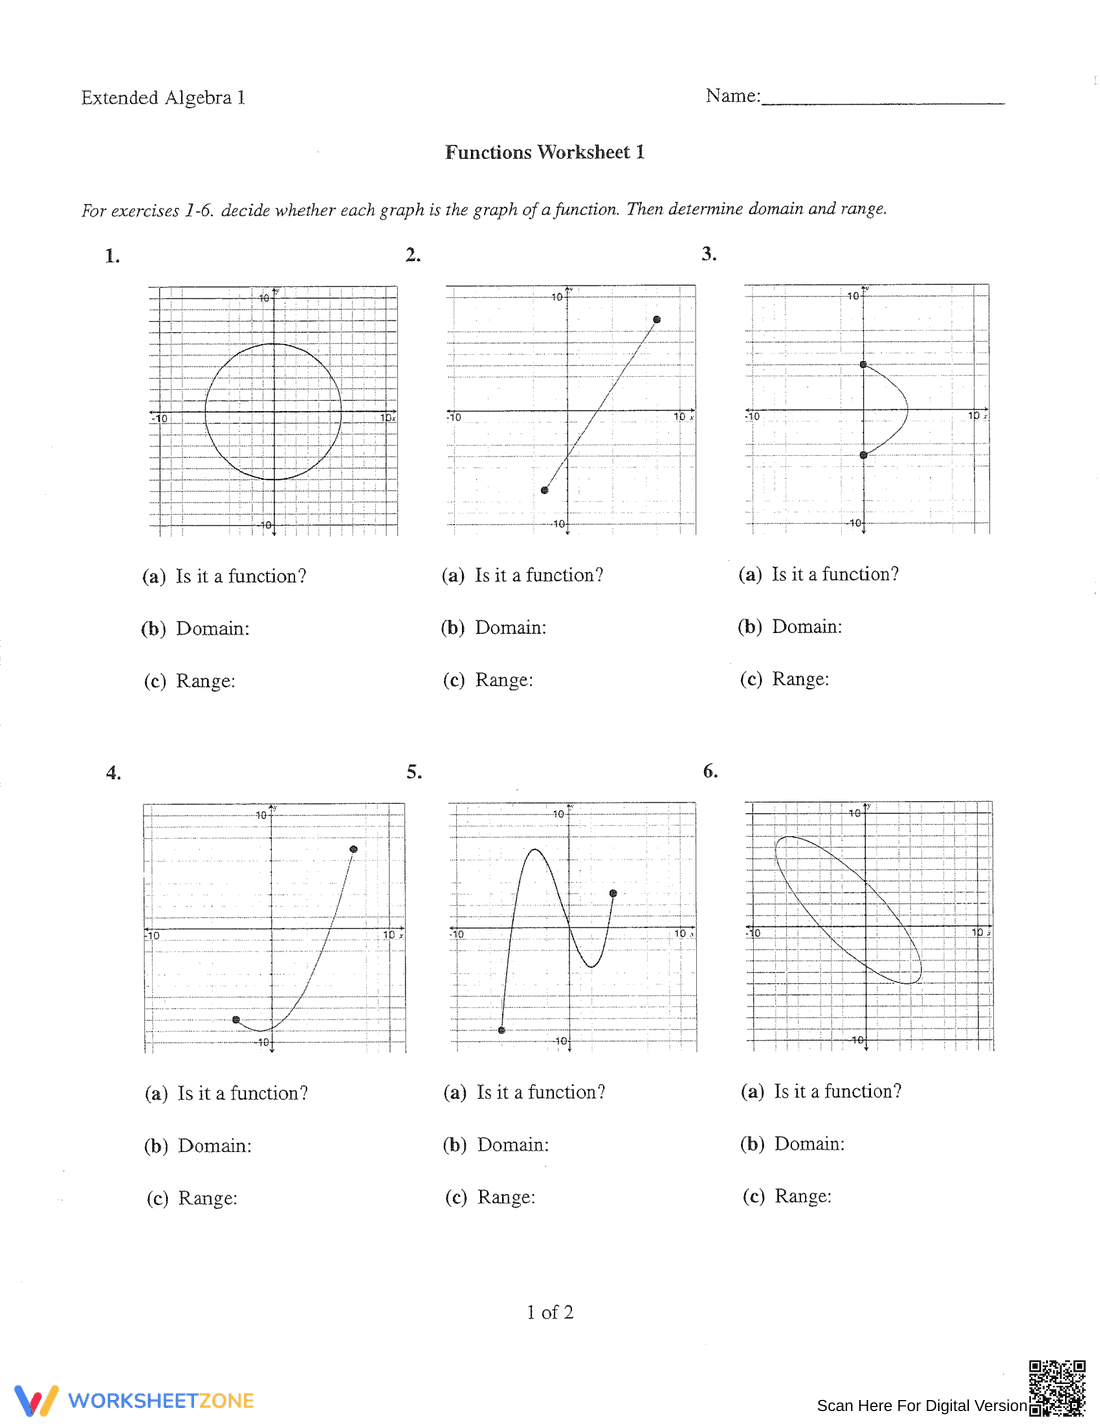
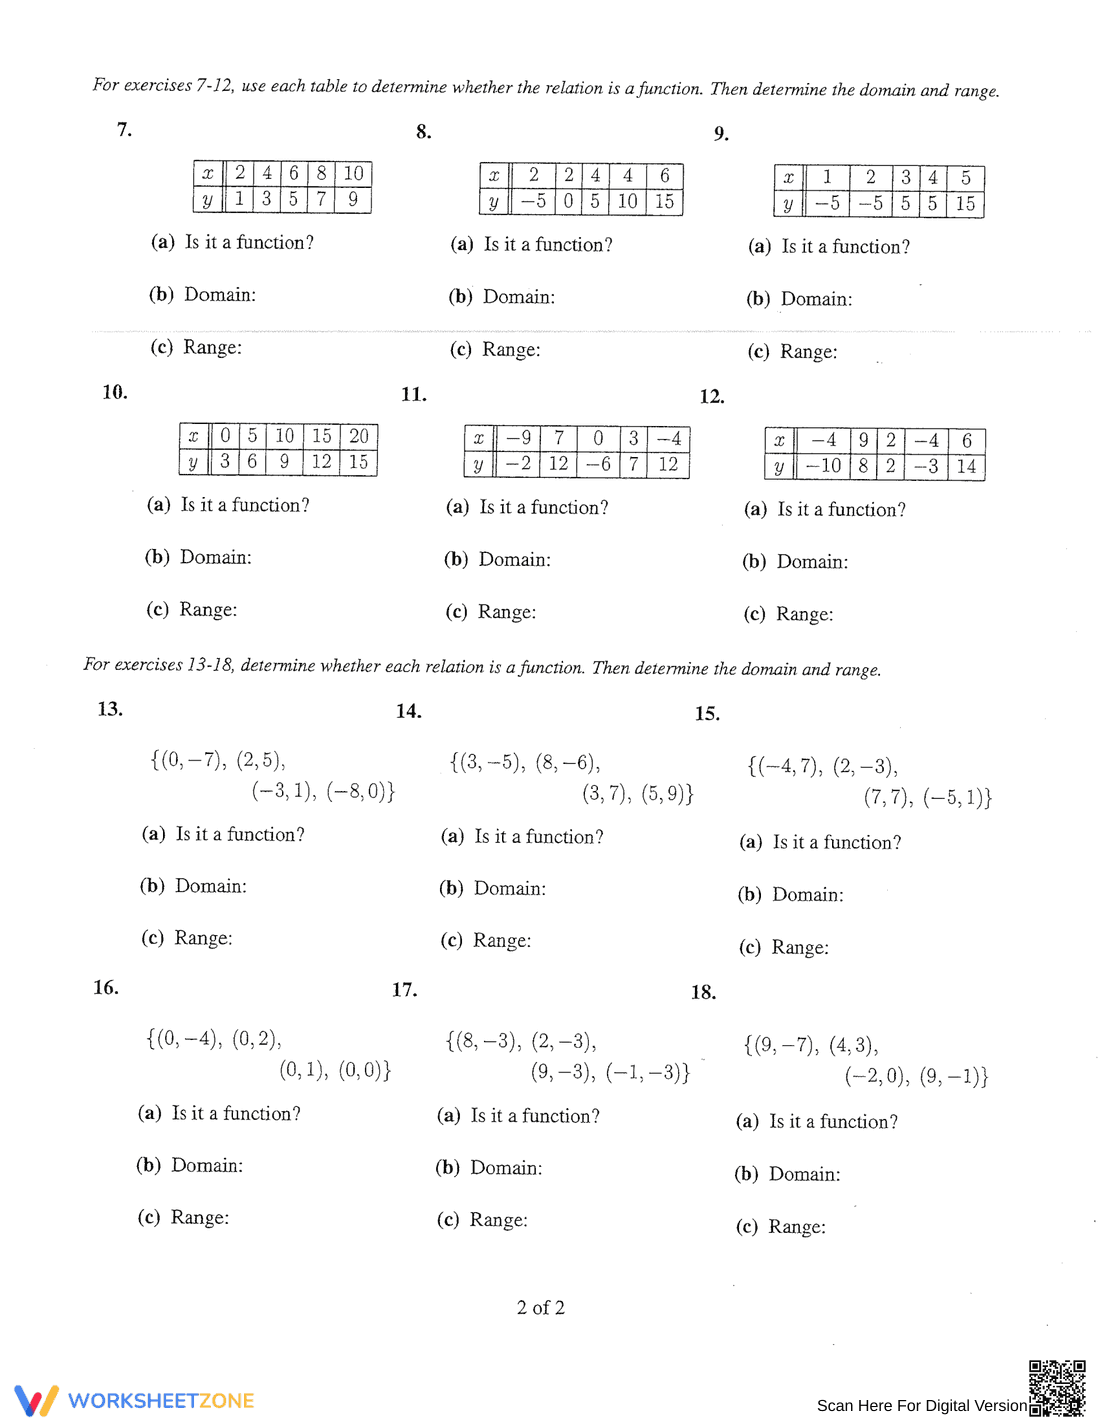
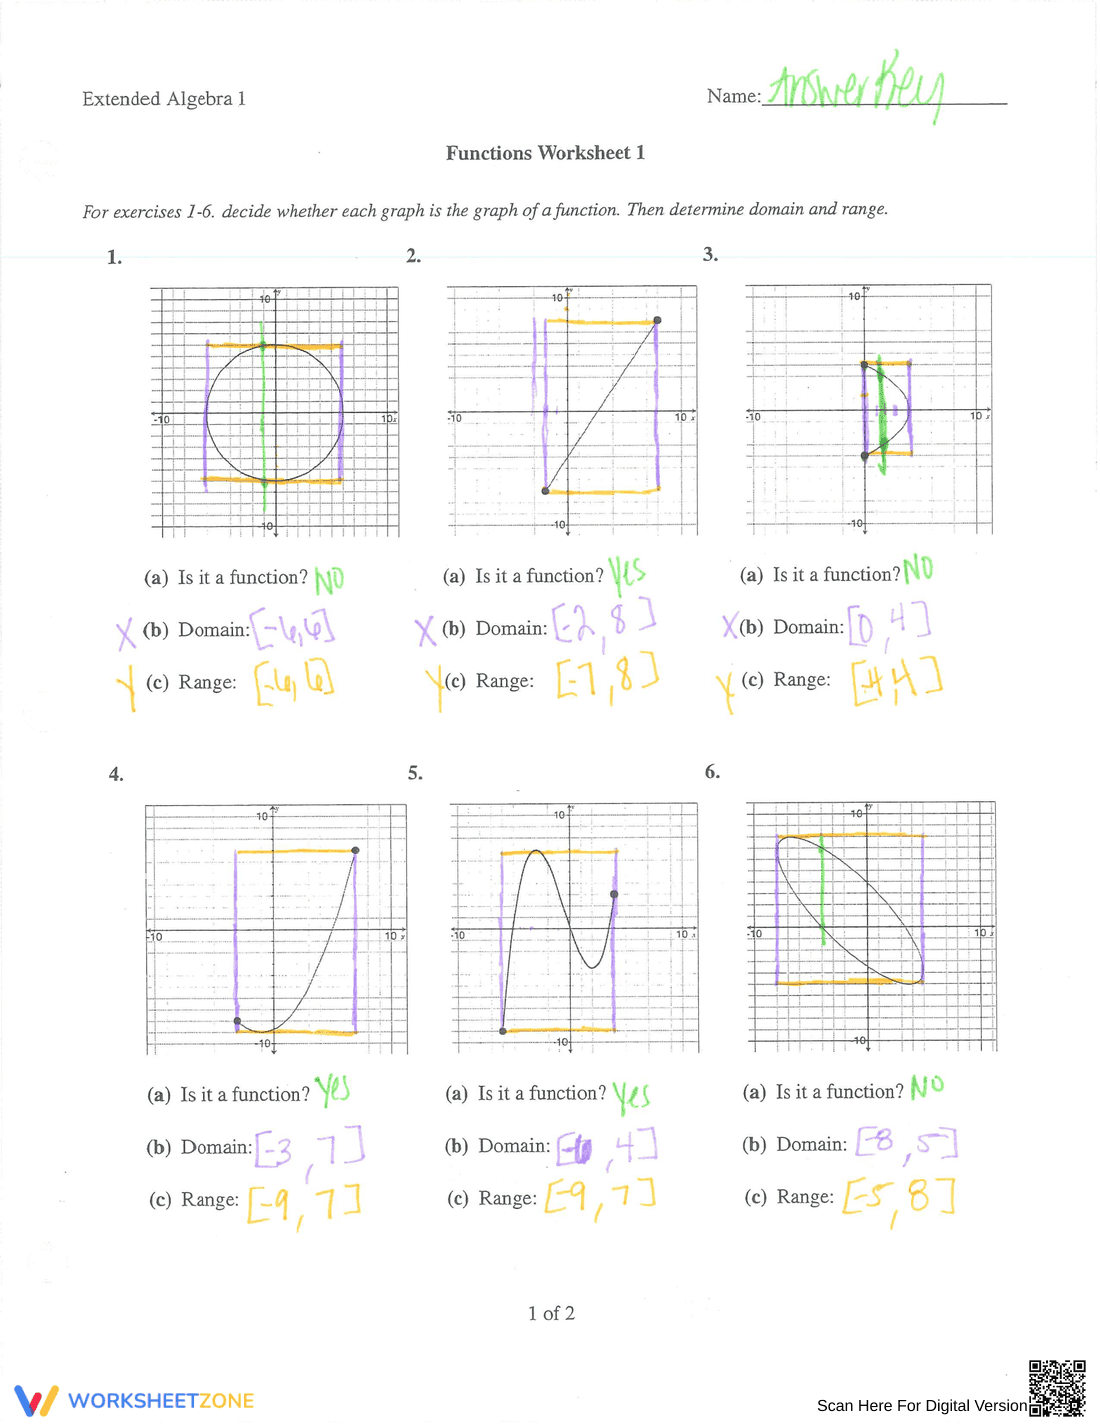
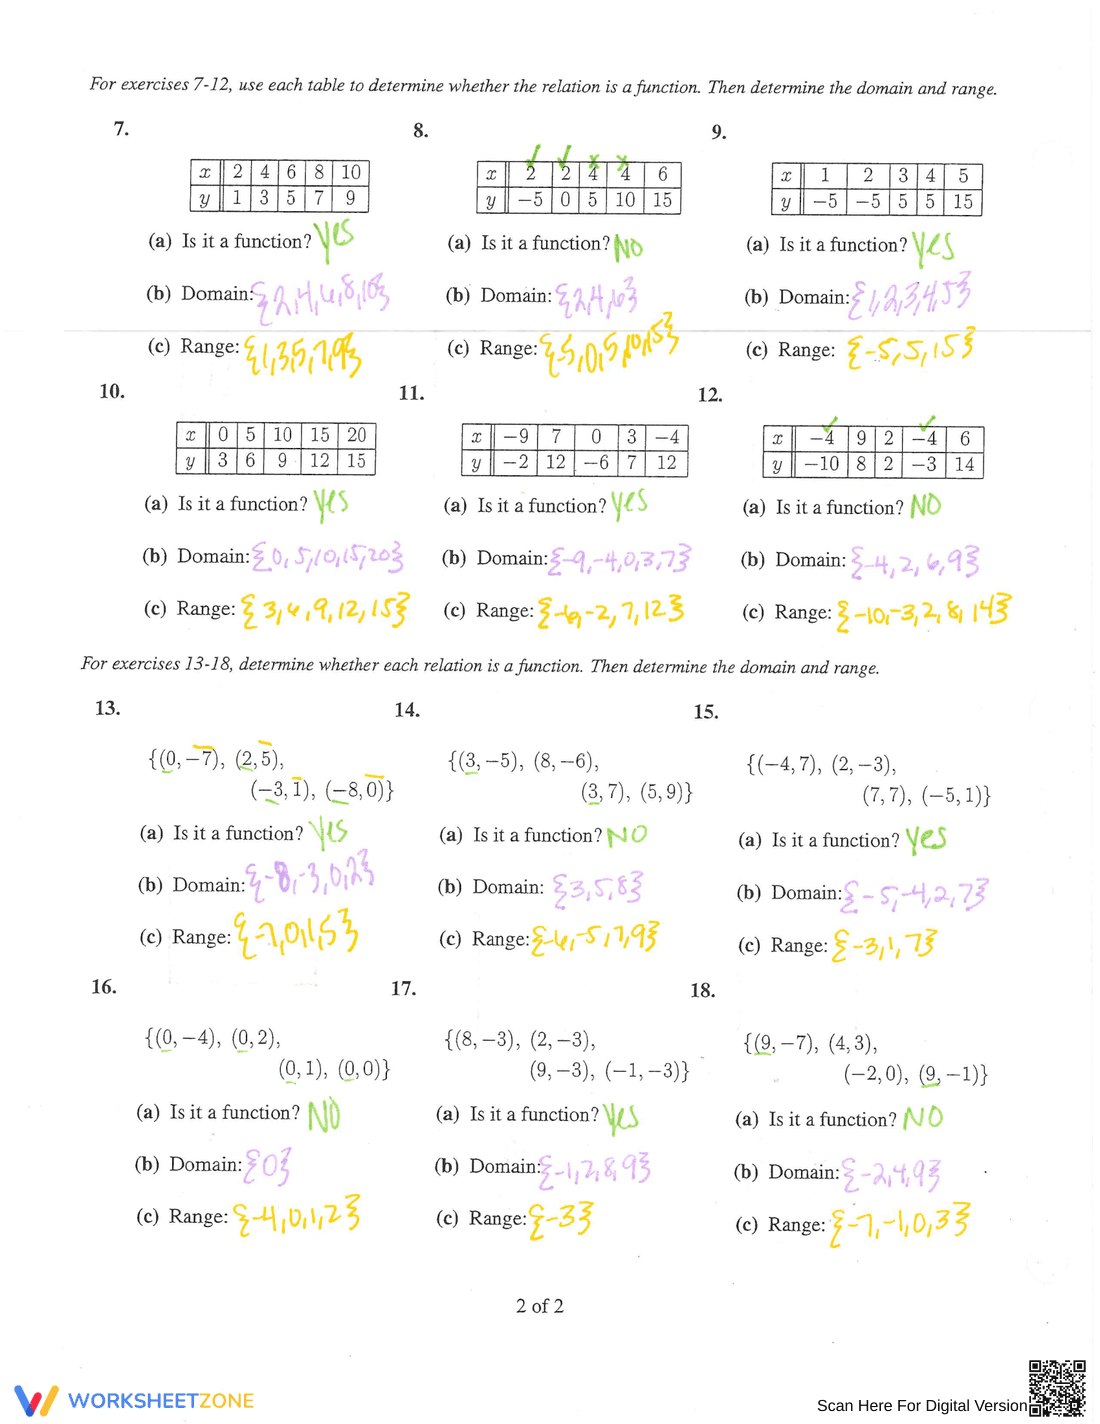
This is a functions worksheet. It presents six different graphs on coordinate planes. For each graph, the student is asked to determine if it represents a function, and then to determine the domain and range of the graph. The worksheet is labeled 'Extended Algebra 1'.
Grade Level Suitability:
This worksheet is suitable for high school students, specifically grades 9-10, studying Algebra 1 or introductory precalculus. The concepts of functions, domain, and range are typically introduced at this level.
Why Use It:
This worksheet helps students practice identifying functions graphically using the vertical line test. It also reinforces their understanding of domain and range, requiring them to visually analyze graphs and determine the set of possible input and output values.
How to Use It:
Students should examine each graph individually. First, they need to determine if the graph represents a function. Then, they should identify the domain by looking at the x-values that the graph covers and the range by looking at the y-values. Answers should be written in the spaces provided.
Target Users:
This worksheet is designed for students learning about functions, domain, and range in an Algebra 1 or precalculus course. It's also suitable for students who need extra practice with graphical analysis and function identification.