


























1 / 2
0
Views
0
Downloads


0.0
0
Save
0 Likes
Share
Fruit Survey Bar Graph Activity
0 Views
0 Downloads
Paste this activity's link or code into your existing LMS (Google Classroom, Canvas, Teams, Schoology, Moodle, etc.).
Students can open and work on the activity right away, with no student login required.
You'll still be able to track student progress and results from your teacher account.
Information
Description
What It Is:
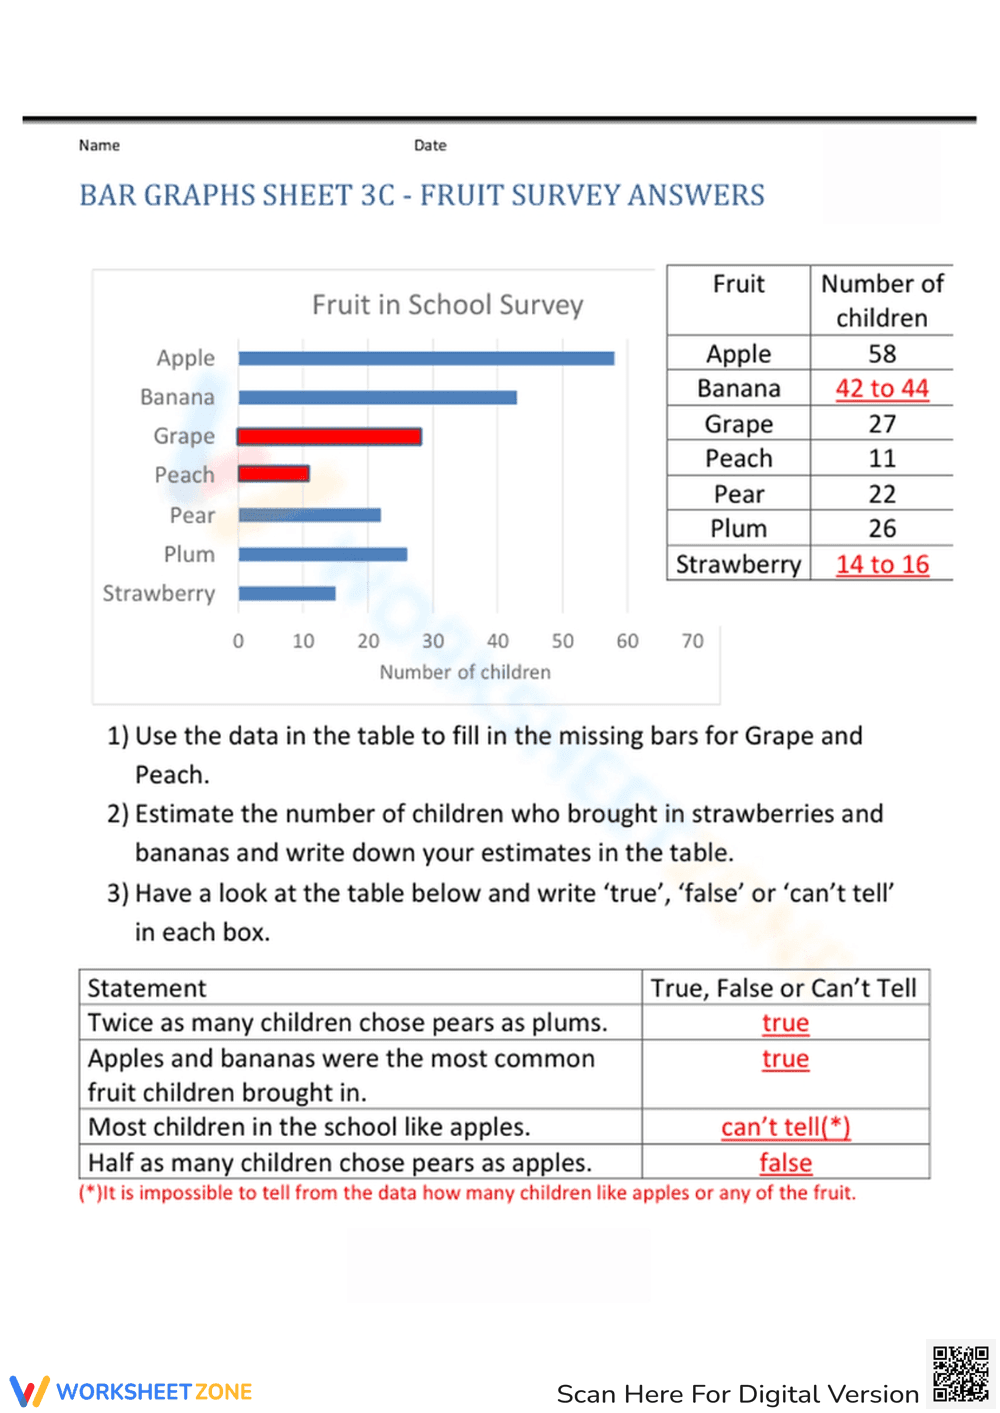
This bar graphs worksheet features a fruit survey where students analyze data showing how many children brought different fruits to school, using both a bar graph and a data table.
Why Use It:
It strengthens skills in reading bar graphs, interpreting tables, estimating values, and evaluating statements using real-world data in a meaningful classroom context.
How to Use It:
• Use the data table to complete missing bars on the graph.
• Estimate values for fruits not fully shown and record estimates.
• Decide whether given statements are true, false, or can’t be determined from the data.
Grade Suitability:
Best suited for Grade 3–Grade 4.
• Grade 3 students developing data interpretation and estimation skills.
• Grade 4 students practicing multi-step reasoning with graphs and tables.
Target Users:
Elementary teachers, students, parents, homeschool families, and math intervention educators.
This bar graphs worksheet features a fruit survey where students analyze data showing how many children brought different fruits to school, using both a bar graph and a data table.
Why Use It:
It strengthens skills in reading bar graphs, interpreting tables, estimating values, and evaluating statements using real-world data in a meaningful classroom context.
How to Use It:
• Use the data table to complete missing bars on the graph.
• Estimate values for fruits not fully shown and record estimates.
• Decide whether given statements are true, false, or can’t be determined from the data.
Grade Suitability:
Best suited for Grade 3–Grade 4.
• Grade 3 students developing data interpretation and estimation skills.
• Grade 4 students practicing multi-step reasoning with graphs and tables.
Target Users:
Elementary teachers, students, parents, homeschool families, and math intervention educators.


