


























Views
Downloads




Essential Population Models Worksheet | Grade 9 Biology
Paste this activity's link or code into your existing LMS (Google Classroom, Canvas, Teams, Schoology, Moodle, etc.).
Students can open and work on the activity right away, with no student login required.
You'll still be able to track student progress and results from your teacher account.
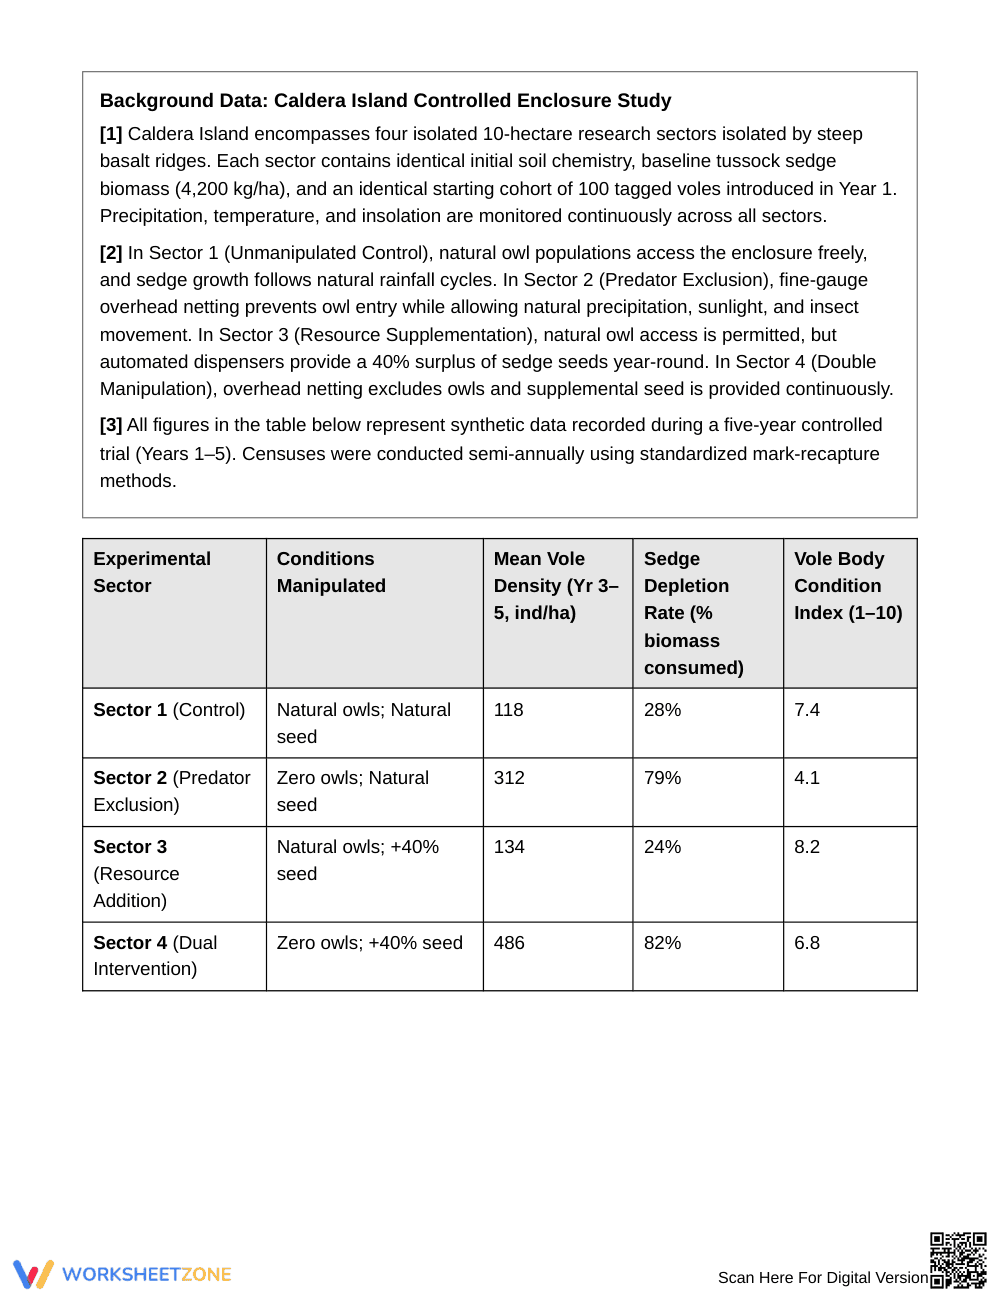
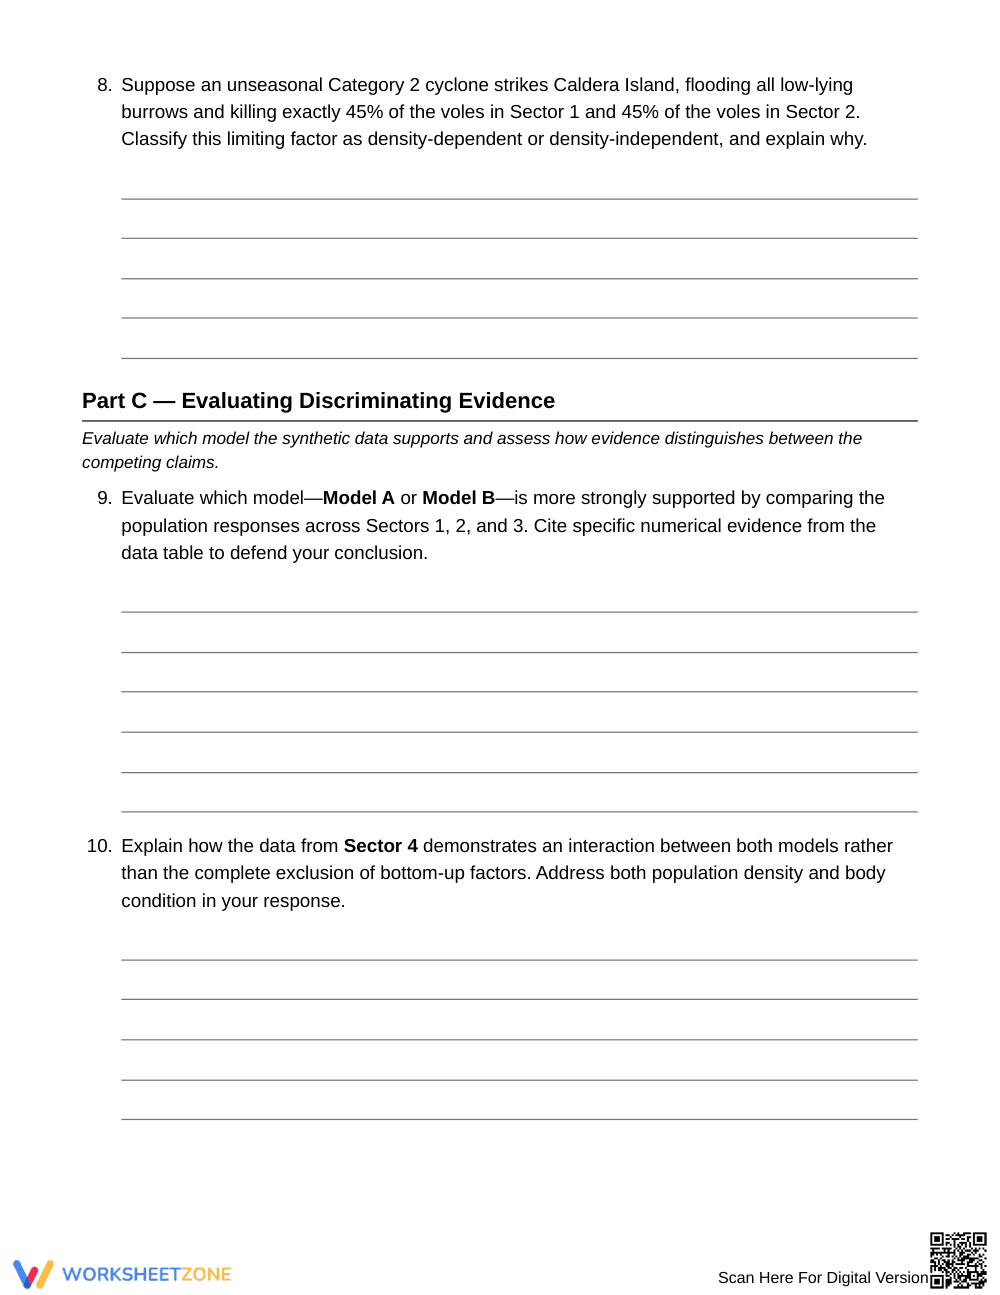
This worksheet guides Grade 9 biology students through ten focused problems that compare controlled population models and sharpen their ability to interpret ecological data. By the end, learners will confidently select, justify, and evaluate model explanations for vole dynamics on Caldera Island.
At a Glance
- Grade: 9 · Subject: Biology
- Standard:
— Students compare controlled population models using data to draw ecological conclusions through data analysis- Skill Focus: Compare Controlled Population Models
- Format: 5 pages · 10 problems · Answer key included · PDF quickly
- Best For: inquiry‑based effective ecology lessons in middle school
- Time: 20–30 minutes
Inside the 5‑page packet you’ll find a concise introduction, a worked example, a word bank of key terms, and ten tasks split across three parts: data interpretation, variable analysis, and model evaluation. The answer key spans two pages for quick grading.
- Guided practice (3 problems) – students use the provided word bank and a step‑by‑step example to predict model outcomes.
- Supported practice (4 problems) – learners apply the same reasoning with fewer prompts, interpreting tables and graphs independently.
- Independent practice (3 problems) – students answer without scaffolds, synthesizing data to choose the best‑fitting model.
The sequence follows the classic I Do, We Do, You Do release.
This resource aligns with the 9th‑grade Biology expectation that students compare controlled population models to explain ecological patterns. Though a specific code is not listed, the content meets state and NGSS criteria for modeling and data analysis. Both standard references can be copied directly into lesson plans, IEP goals, or district curriculum mapping tools.
Use the worksheet as a pre‑lab activity to activate prior knowledge before a field‑work simulation, or as a post‑lecture assessment to gauge model comprehension. While students work, note who correctly identifies density‑dependent versus density‑independent factors; this observation informs immediate feedback. Expected completion time is 20–30 minutes.
Designed for ninth‑grade biology students, the worksheet supports mixed‑ability classes with built‑in scaffolds. It pairs well with the Caldera Island case study video and an anchor chart of top‑down vs. bottom‑up regulation for seamless integration.
Research shows that explicit model comparison tasks improve students’ scientific reasoning (Fisher & Frey, 2014). This worksheet embodies that approach by requiring learners to evaluate top‑down and bottom‑up explanations using authentic data, a strategy linked to higher scores on NGSS‑aligned assessments. The activity also reflects findings from the RAND AIRS 2024 report, which identified data‑rich, inquiry‑based exercises as key drivers of engagement in high‑school biology. By integrating a worked example, word bank, and progressive practice, the worksheet aligns with evidence‑based practices that promote deeper conceptual understanding and transfer. Teachers can confidently assign this resource, knowing it meets rigorous research standards and supports measurable growth in model‑comparison skills. Furthermore, EdReports 2024 rated model‑focused tasks as highly effective for developing analytical proficiency, reinforcing the worksheet’s alignment with national quality benchmarks. The inclusion of real‑world ecological scenarios also addresses the call for context‑rich science instruction.


