


























Views
Downloads



Essential Percent Survey Claims Worksheet | Grade 7 Math
Paste this activity's link or code into your existing LMS (Google Classroom, Canvas, Teams, Schoology, Moodle, etc.).
Students can open and work on the activity right away, with no student login required.
You'll still be able to track student progress and results from your teacher account.
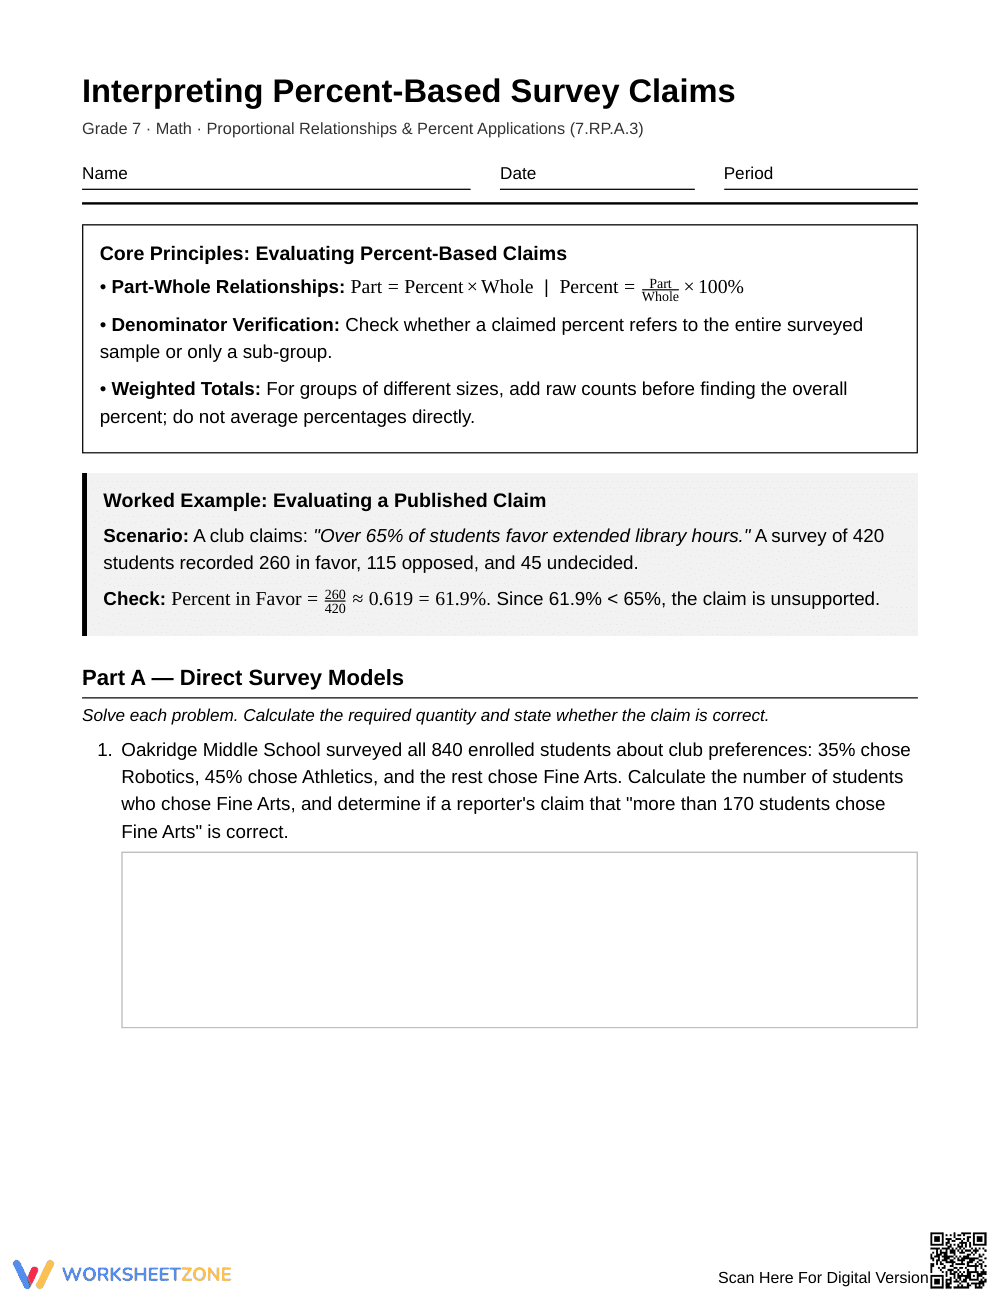
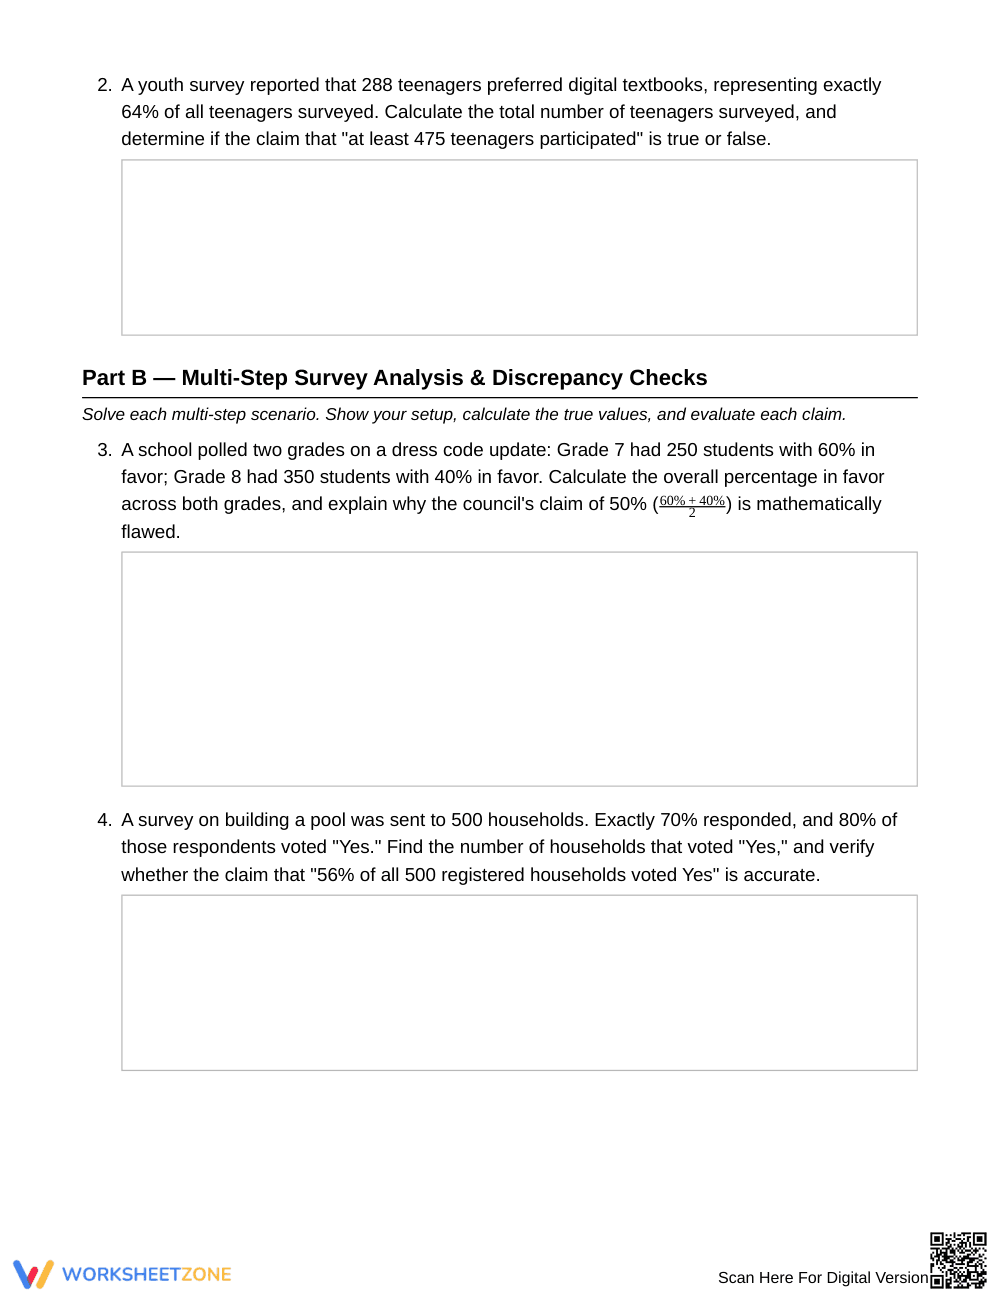
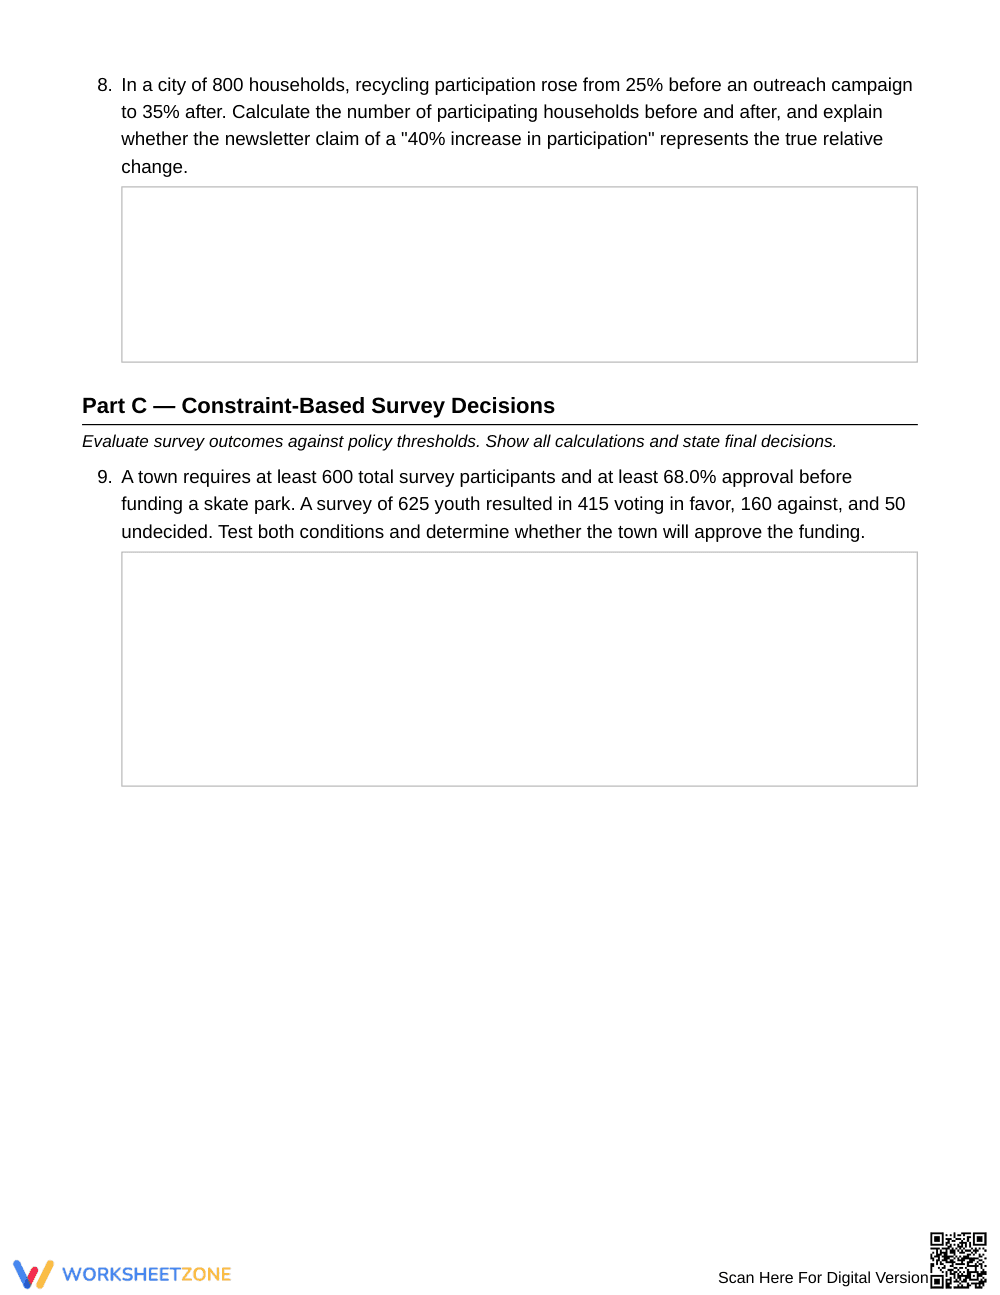
Mastering multi-step percent concepts is critical for real-world mathematical literacy. This 5-page Grade 7 math resource teaches students to evaluate percent-based survey claims, calculate true sample statistics, and identify misleading mathematical arguments. Through 10 real-world survey scenarios, learners verify denominators, calculate weighted percentages, and evaluate public claims against strict decision thresholds.
At a Glance
- Grade: 7 · Subject: Math
- Standard:
7.RP.A.3— Solve multi-step percent and proportional relationship problems in real-world contexts- Skill Focus: Interpreting and evaluating percent survey claims
- Format: 5 pages · 10 problems · Answer key included · PDF
- Best For: Multi-step percent application and claim evaluation
- Time: 40–50 minutes
This resource features a foundational reference box outlining part-whole relationships, denominator verification rules, and weighted percentage principles, accompanied by a complete worked example. Students progress across three distinct sections comprising 10 multi-step survey analysis tasks, supported by a 2-page detailed answer key with full mathematical explanations.
Skill Progression
- Guided Practice (Part A): Students solve 2 direct survey modeling problems with baseline part-whole setups to verify straightforward survey assertions.
- Supported Practice (Part B): Learners complete 6 multi-step analytical tasks requiring denominator checks, multi-group weighted totals, and critical explanations of common statistical fallacies.
- Independent Practice (Part C): Students tackle 2 constraint-based policy scenarios, independently testing dual-threshold conditions to justify administrative and civic decisions.
This structured progression utilizes a gradual-release model to shift students from computational verification to sophisticated critical analysis.
Standards Alignment
This activity directly targets 7.RP.A.3: Use proportional relationships to solve multistep ratio and percent problems. Students calculate percentages of sub-groups, find whole populations from partial survey returns, and compute compound rates. Both standard codes can be copied directly into lesson plans, IEP goals, or district curriculum mapping tools.
How to Use It
Use this worksheet after direct instruction on multi-step percents as collaborative partner practice or an independent mastery check. During instruction, observe whether students falsely average percentages across unequal sub-groups in Part B or correctly combine raw totals first. Anticipate completing this 10-task worksheet in 40 to 50 minutes of instructional time.
Who It's For
Designed for Grade 7 general mathematics, accelerated Grade 6 classes, or Grade 8 intervention groups needing reinforcement with proportional reasoning. Pair this printable with a direct instruction lesson on multi-step percent changes or an anchor chart displaying common misleading survey representations.
According to Fisher & Frey (2014), structured instructional frameworks that transition students systematically from worked examples to collaborative and independent problem-solving significantly increase mathematical proficiency and analytical reasoning. This Grade 7 mathematics resource addresses standard 7.RP.A.3 by requiring learners to solve multi-step percent problems and evaluate the validity of published survey claims. Rather than simply calculating routine percentages, students must critically interrogate sample sizes, distinguish sub-group respondents from total populations, and expose flawed mathematical assumptions such as averaging rates from groups of unequal sizes. By engaging in these authentic data analysis tasks, middle school learners bridge procedural computation with conceptual inquiry, developing the precise quantitative reasoning skills emphasized across modern state standards. The scaffolded 10-problem format ensures that students build the foundational mastery and critical discernment necessary to interpret complex statistical data in academic and civic contexts.


