


1 / 2
0
Views
0
Downloads
0.0
0
Save
0 Likes
Dot Plots Practice Worksheet for Data Representation
0 Views
0 Downloads
Paste this activity's link or code into your existing LMS (Google Classroom, Canvas, Teams, Schoology, Moodle, etc.).
Students can open and work on the activity right away, with no student login required.
You'll still be able to track student progress and results from your teacher account.
Information
Description
What It Is:
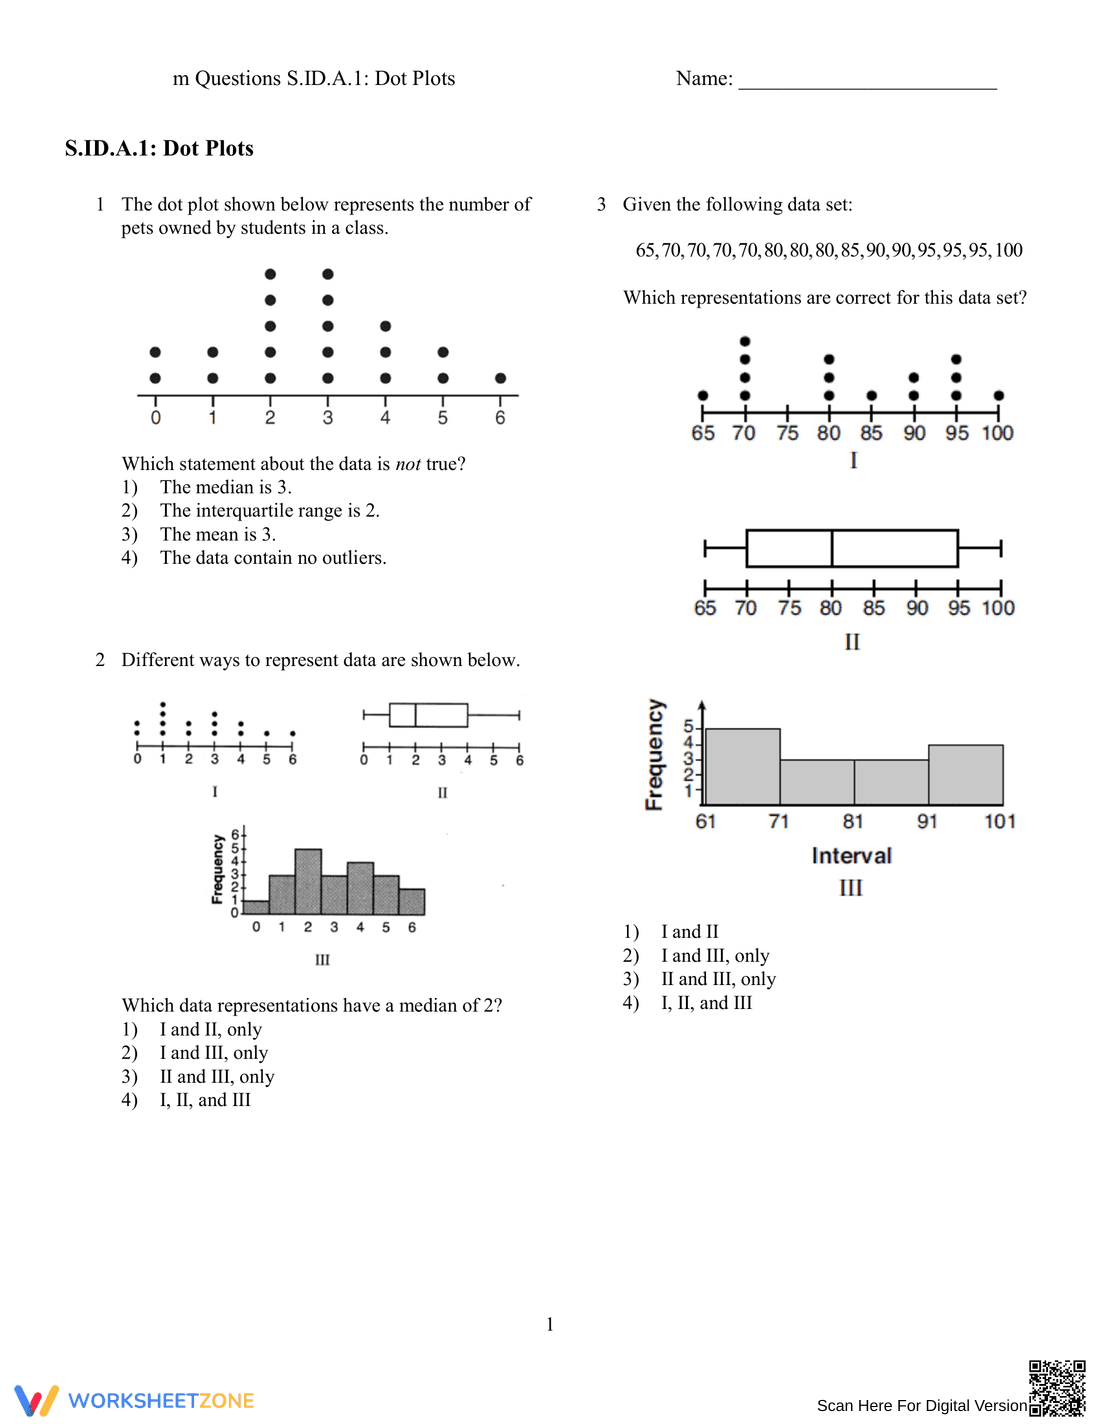
This worksheet provides practice with dot plots, helping students understand how to represent data graphically and interpret the information from a dot plot. It includes questions on data representation, the median, and the range of data.
Why Use It:
This worksheet helps students practice analyzing data using dot plots and interpreting key statistical information such as median, mean, and interquartile range. It is useful for reinforcing concepts in data analysis and representation.
How to Use It:
• Students will read dot plots and answer questions based on the data shown.
• They will also practice interpreting the median, mean, and range from data sets represented by dot plots.
• This worksheet can be used as a review or in preparation for data analysis tests.
Grade Suitability:
Best suited for Grade 7 to 9 students.
• Ideal for lessons on data representation, statistics, and introductory data analysis.
• Can be used in both math and science classes that cover data representation techniques.
Target Users:
• Teachers and students learning data analysis methods.
• Math teachers introducing or reviewing statistical concepts such as dot plots, median, and range.