


Views
Downloads
Essential Dot Plots and Histograms Practice | Grade 6 Math
Paste this activity's link or code into your existing LMS (Google Classroom, Canvas, Teams, Schoology, Moodle, etc.).
Students can open and work on the activity right away, with no student login required.
You'll still be able to track student progress and results from your teacher account.
This comprehensive Grade 6 mathematics worksheet empowers students to master various data representations, including dot plots, box plots, and histograms. By engaging with realistic data sets, learners develop the critical ability to interpret distributions and calculate statistical measures of center and spread. This resource ensures students can transition between graphical formats with accuracy and confidence.
At a Glance
- Grade: 6 · Subject: Math
- Standard:
6.SP.B.4— Display numerical data in plots, including dot plots, histograms, and box plots- Skill Focus: Data Representation & Statistical Analysis
- Format: 3 pages · 3 problems · Answer key included · PDF
- Best For: Independent practice or formative assessment
- Time: 20–30 minutes
What's Inside
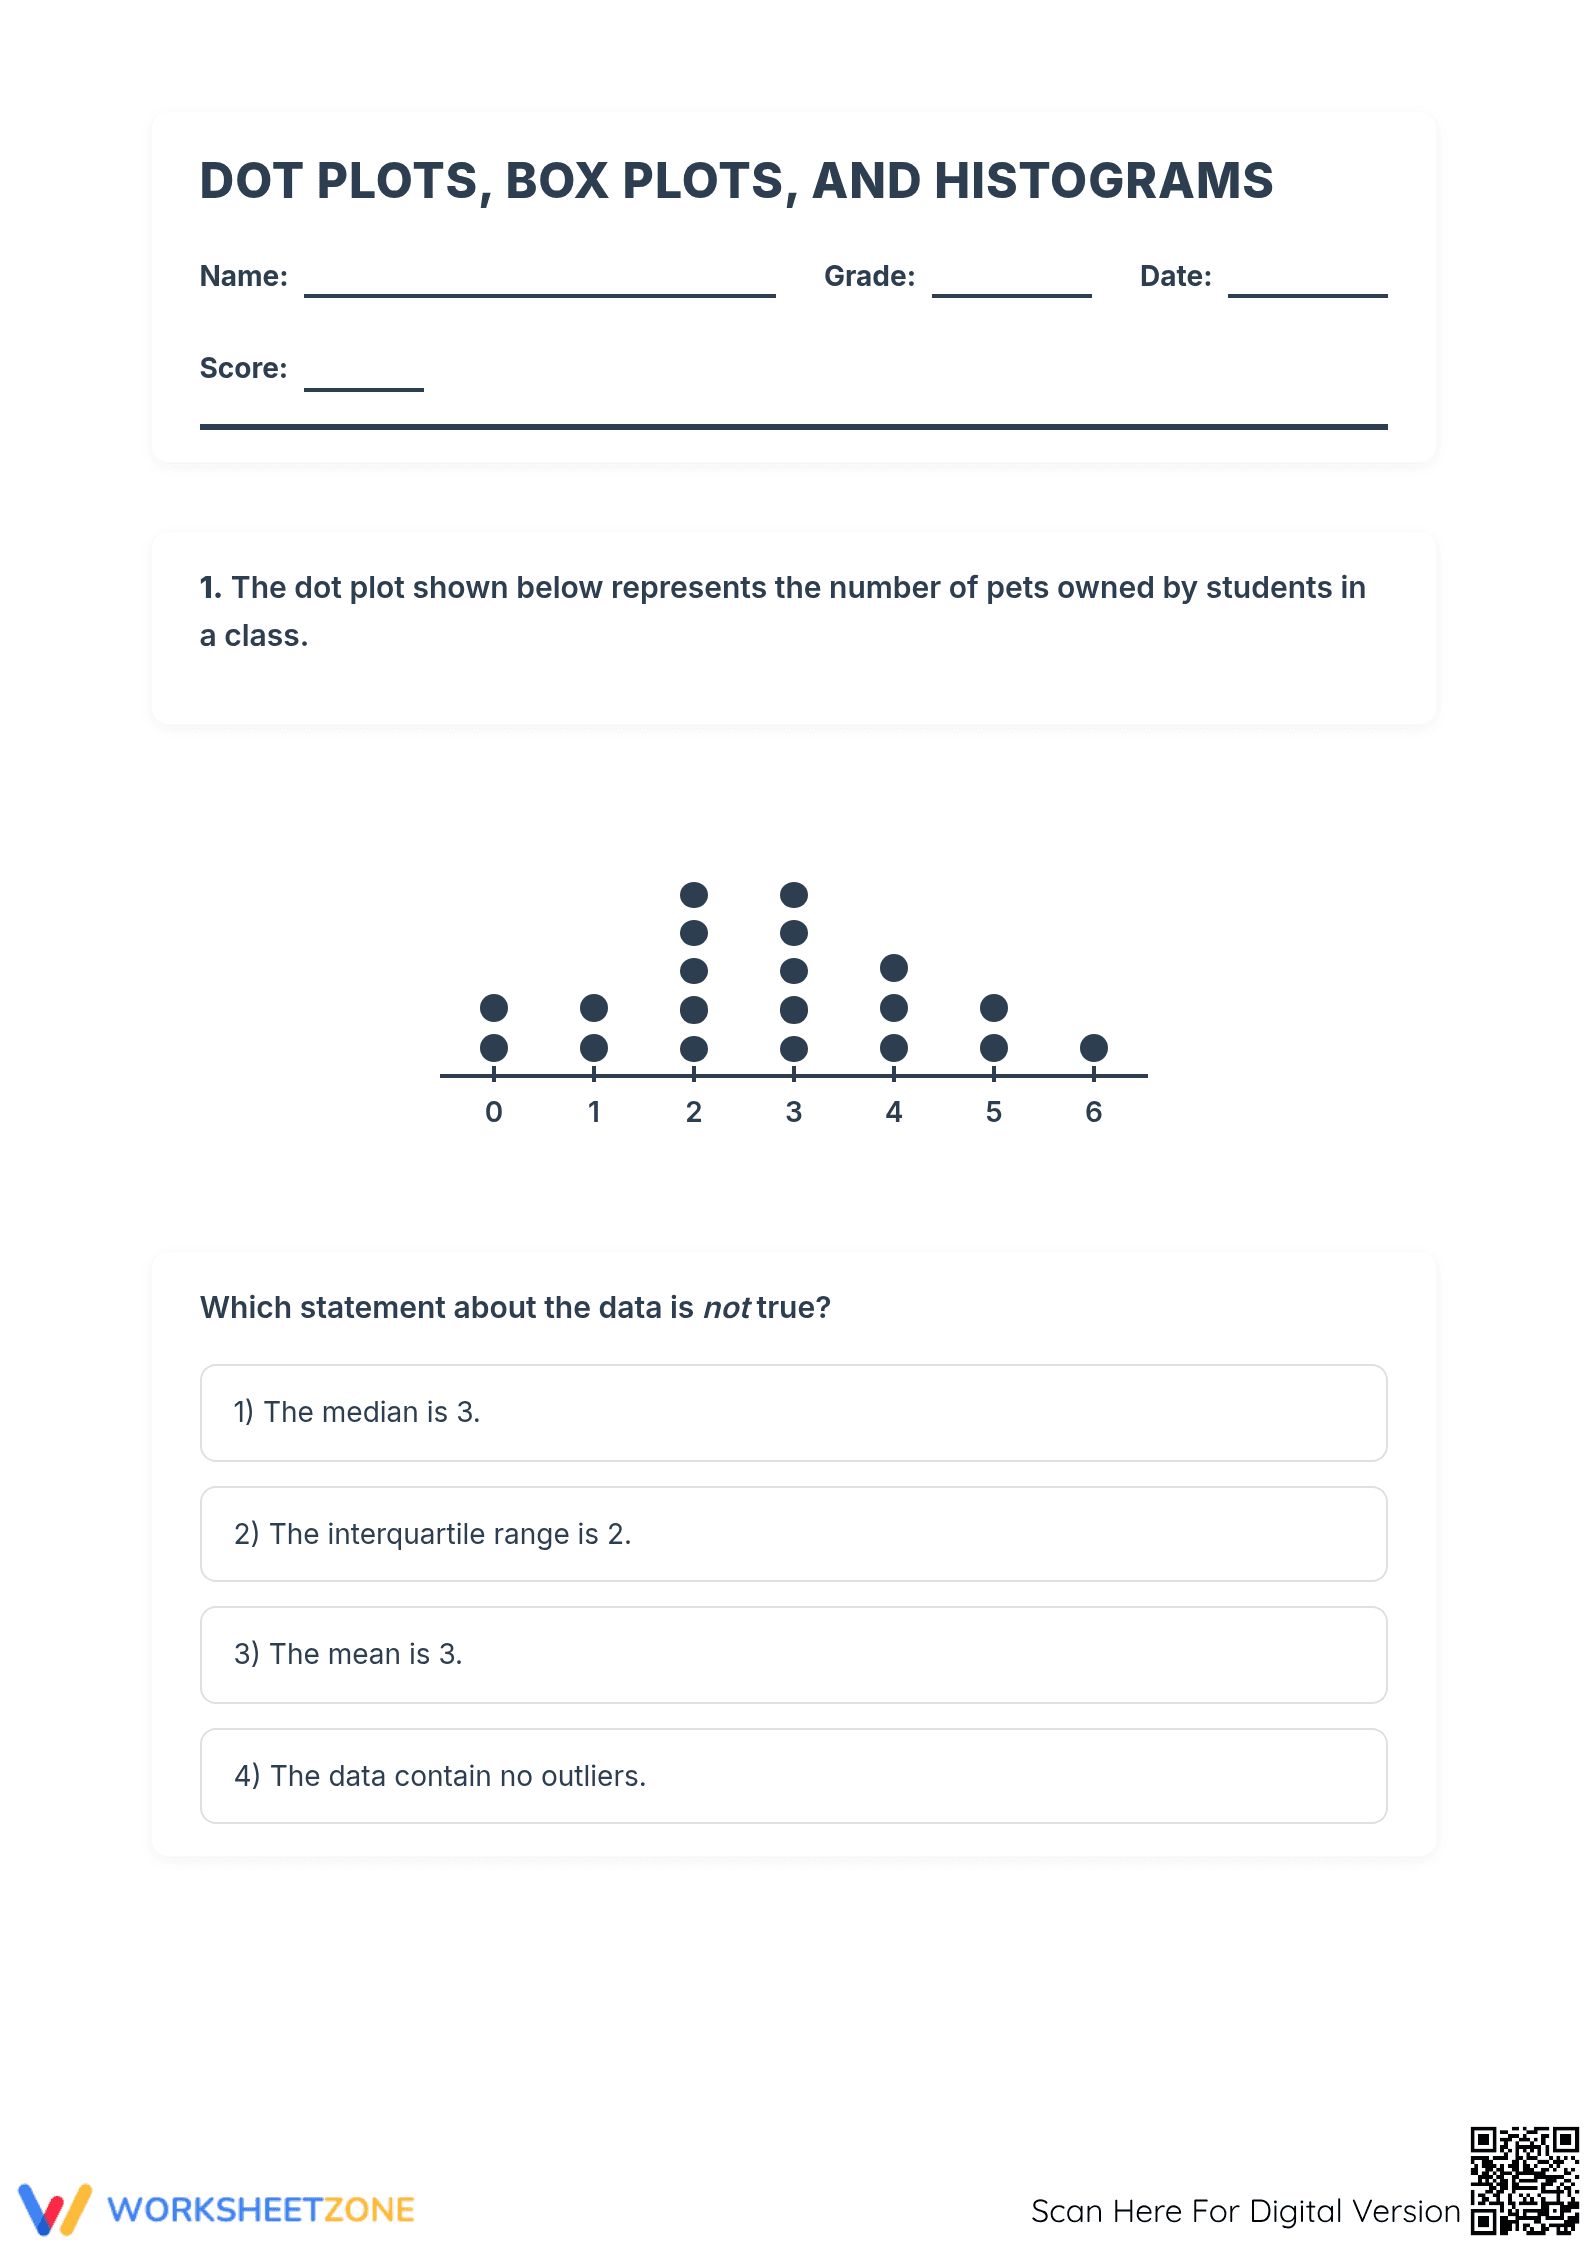
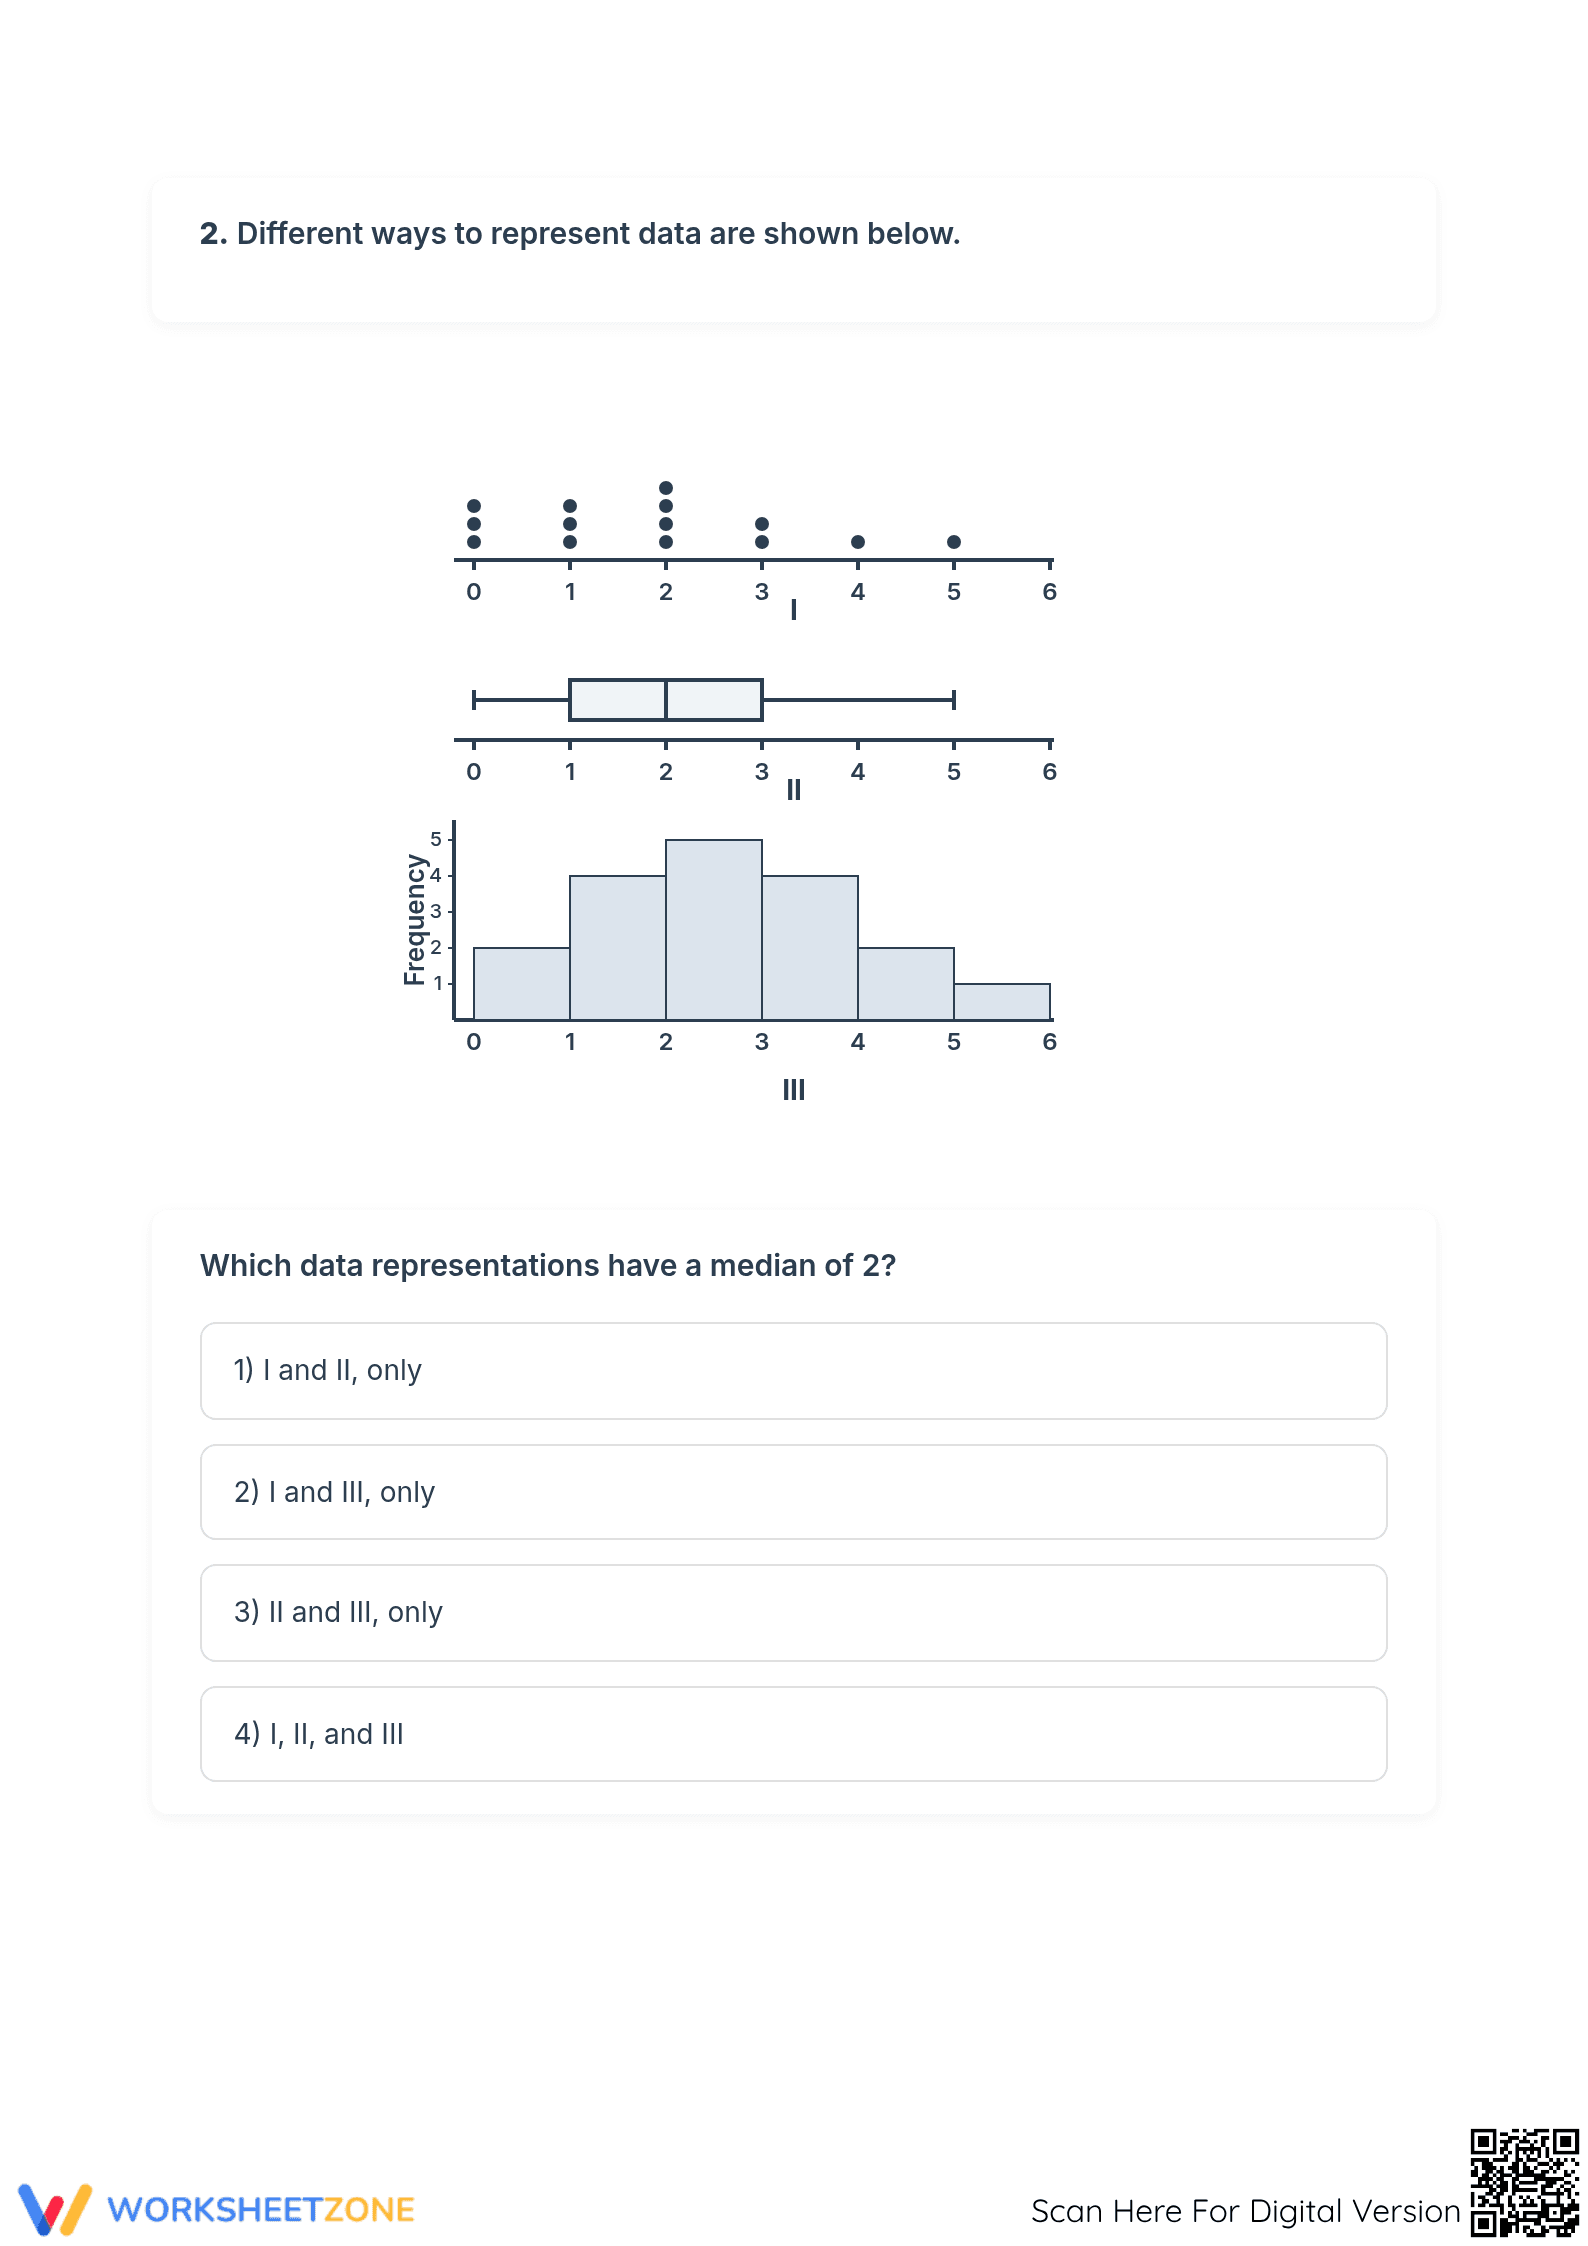
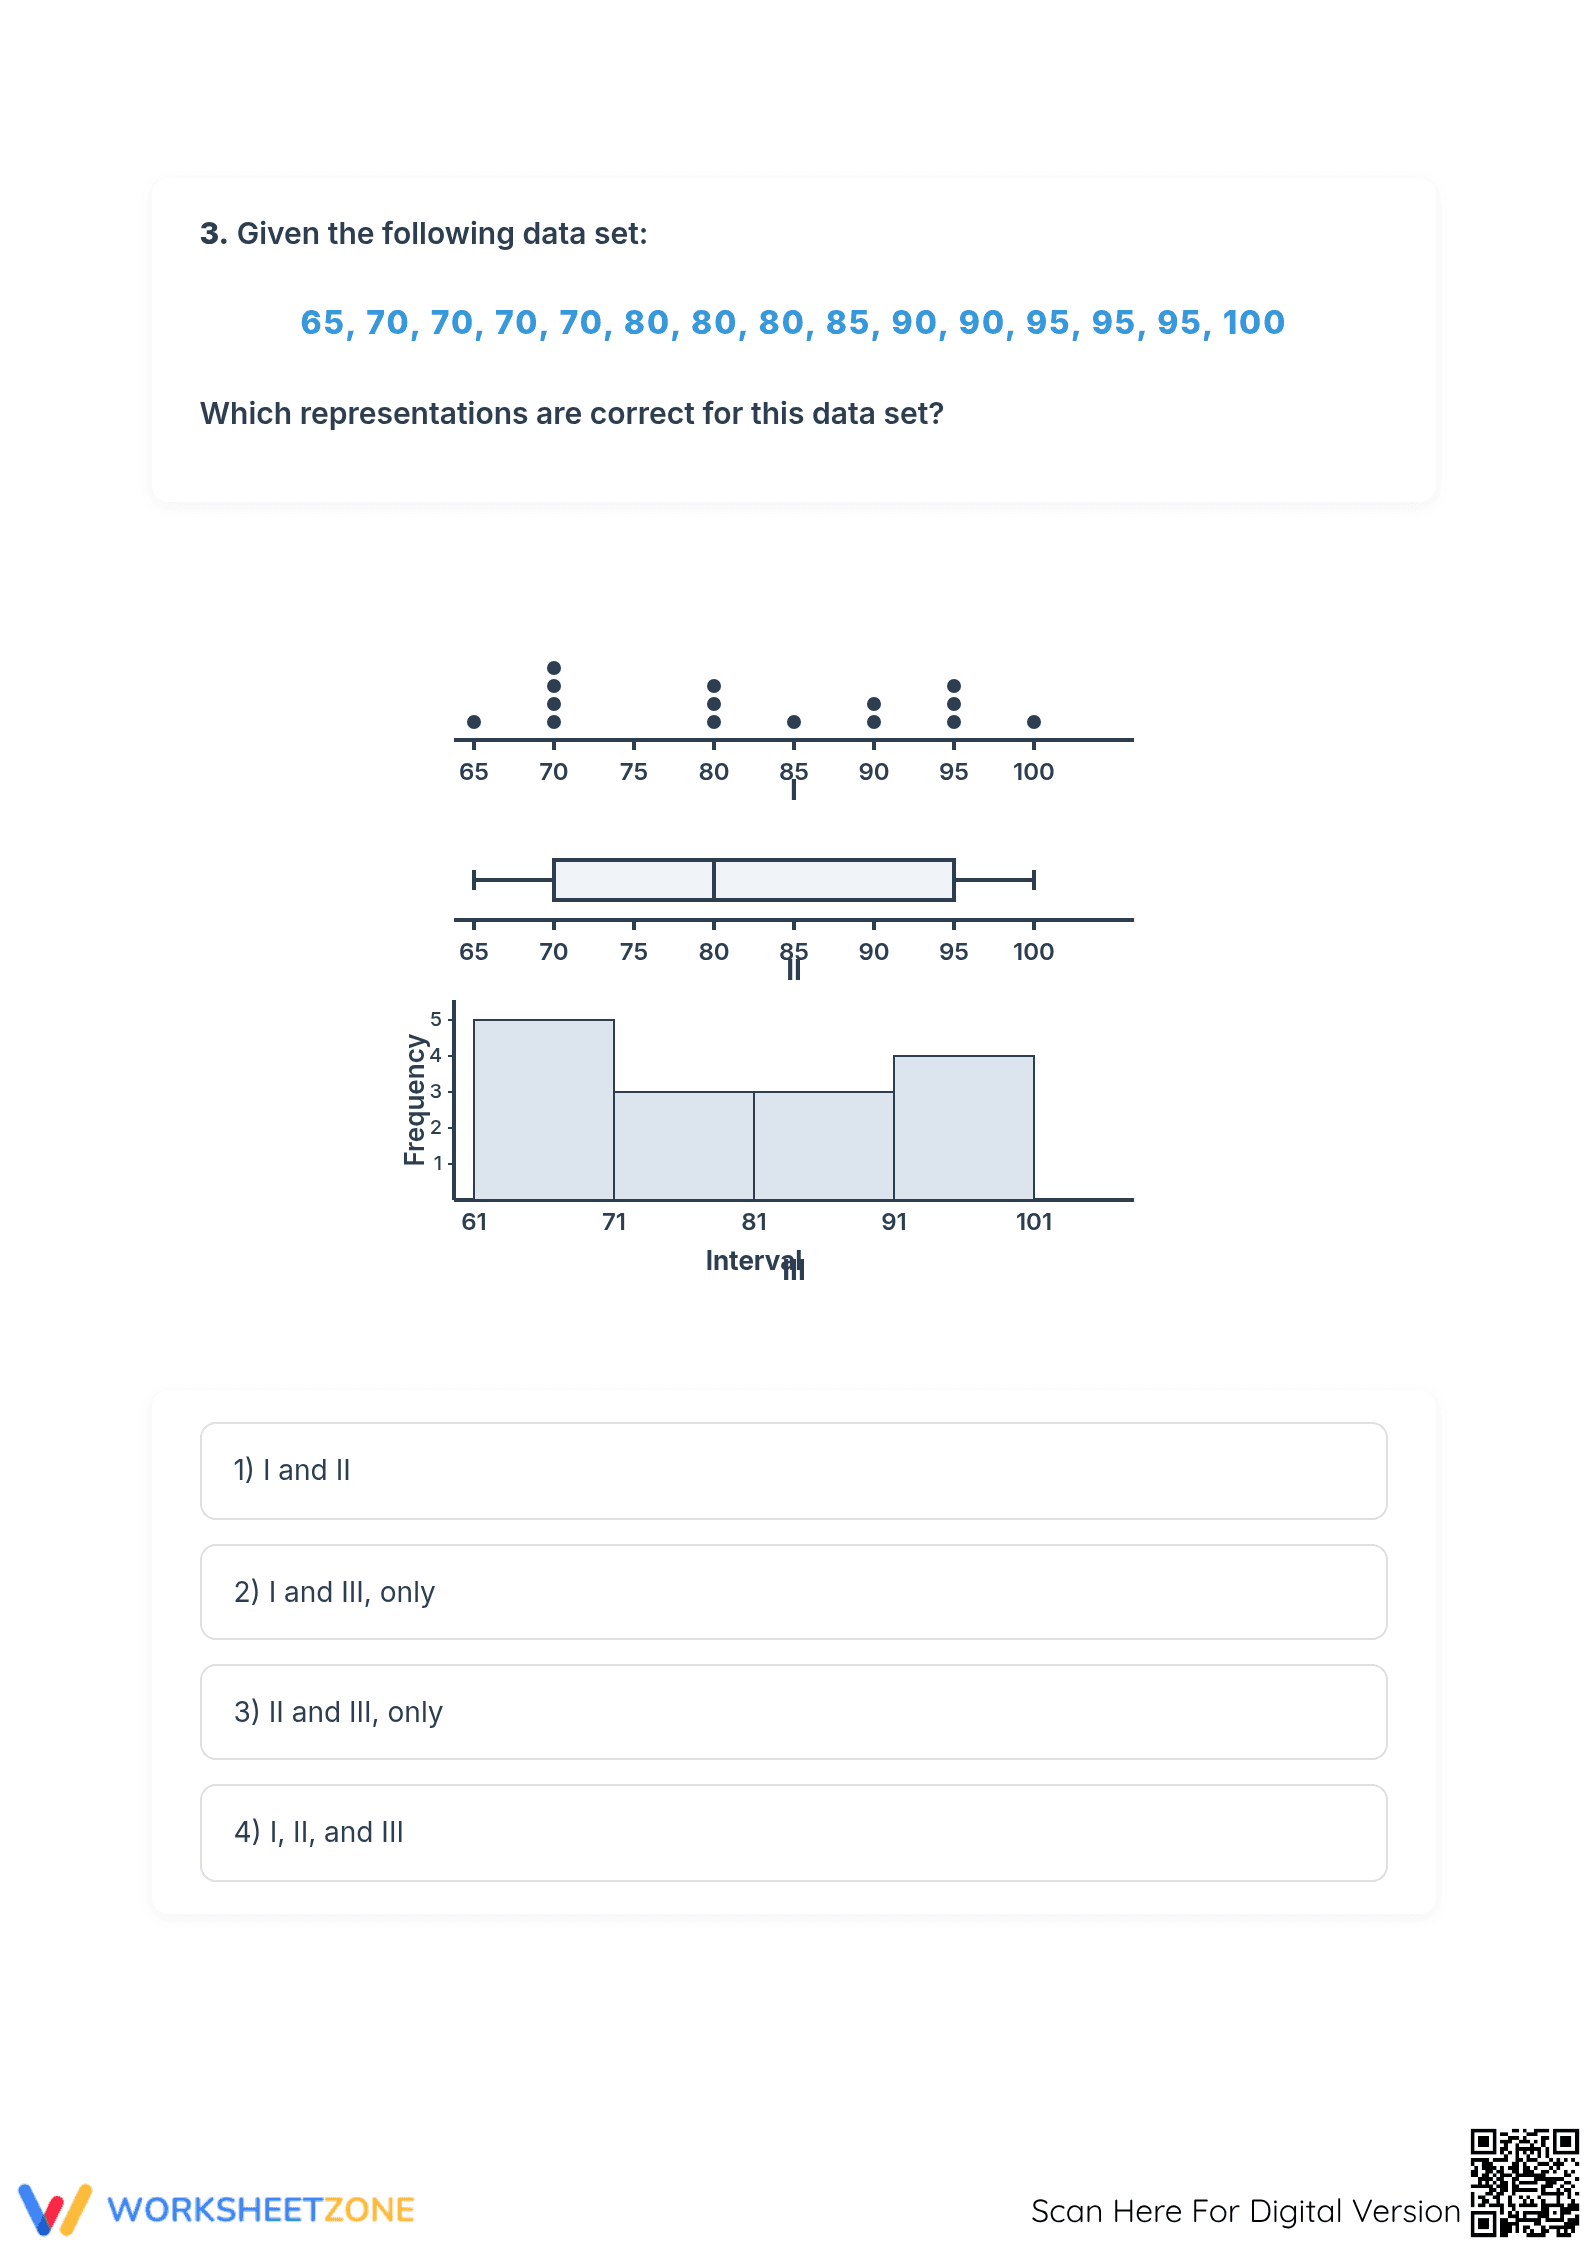
Inside this 3-page PDF, you will find three high-depth problems. The first page focuses on analyzing a dot plot to find the mean, median, and interquartile range. The second page challenges students to compare medians across three different visual formats. The final page provides a raw data set for students to identify correct graphical representations, ensuring a full grasp of data visualization.
Skill Progression
The worksheet follows a structured skill progression.
- Guided Analysis: Students interpret a dot plot, identifying false statements about statistical measures.
- Comparative Practice: This task requires cross-functional analysis of three plots to identify consistent measures of center.
- Independent Validation: Students validate multiple representations against a data set, reinforcing the gradual-release model by moving toward independent mastery.
Standards Alignment
This worksheet is aligned with standard 6.SP.B.4, requiring students to display numerical data in plots. It also supports 6.SP.B.5.C by asking students to describe data attributes. Both standard codes can be copied directly into lesson plans, IEP goals, or district curriculum mapping tools.
How to Use It
This resource is best utilized during the "You Do" phase of a lesson on statistics. After direct instruction on box plots and histograms, assign this worksheet as an independent practice set to check for understanding. Teachers should circulate and observe students as they calculate the interquartile range on Page 1, using this as a formative-assessment point to address common misconceptions about spread. Completion typically takes 25 minutes.
Who It's For
This resource is designed for Grade 6 middle school students but serves as an excellent review for Grade 7 or 8 learners. It is particularly effective for students requiring visual scaffolds to understand abstract statistical concepts. Pair this worksheet with a set of data interpretation anchor charts or a specific passage about data collection to provide a complete, multi-sensory instructional experience for diverse learners.
According to the NAEP 2024 framework, the ability to synthesize information across multiple graphical representations is a hallmark of mathematical proficiency at the middle school level. This worksheet specifically targets standard 6.SP.B.4, ensuring that students can not only create dot plots, box plots, and histograms but also interpret the underlying data structures they represent. Research by Fisher & Frey (2014) emphasizes that "gradual release of responsibility" is most effective when students are asked to validate representations against raw data, a task included in the final section of this printable. By requiring students to calculate measures of center like the median while comparing distinct visual formats, the resource builds the cognitive flexibility needed for high-stakes testing. This instructional approach ensures that students move beyond rote calculation and toward true statistical literacy, providing a robust foundation for more advanced data science and probability topics in subsequent grades.