


Views
Plays
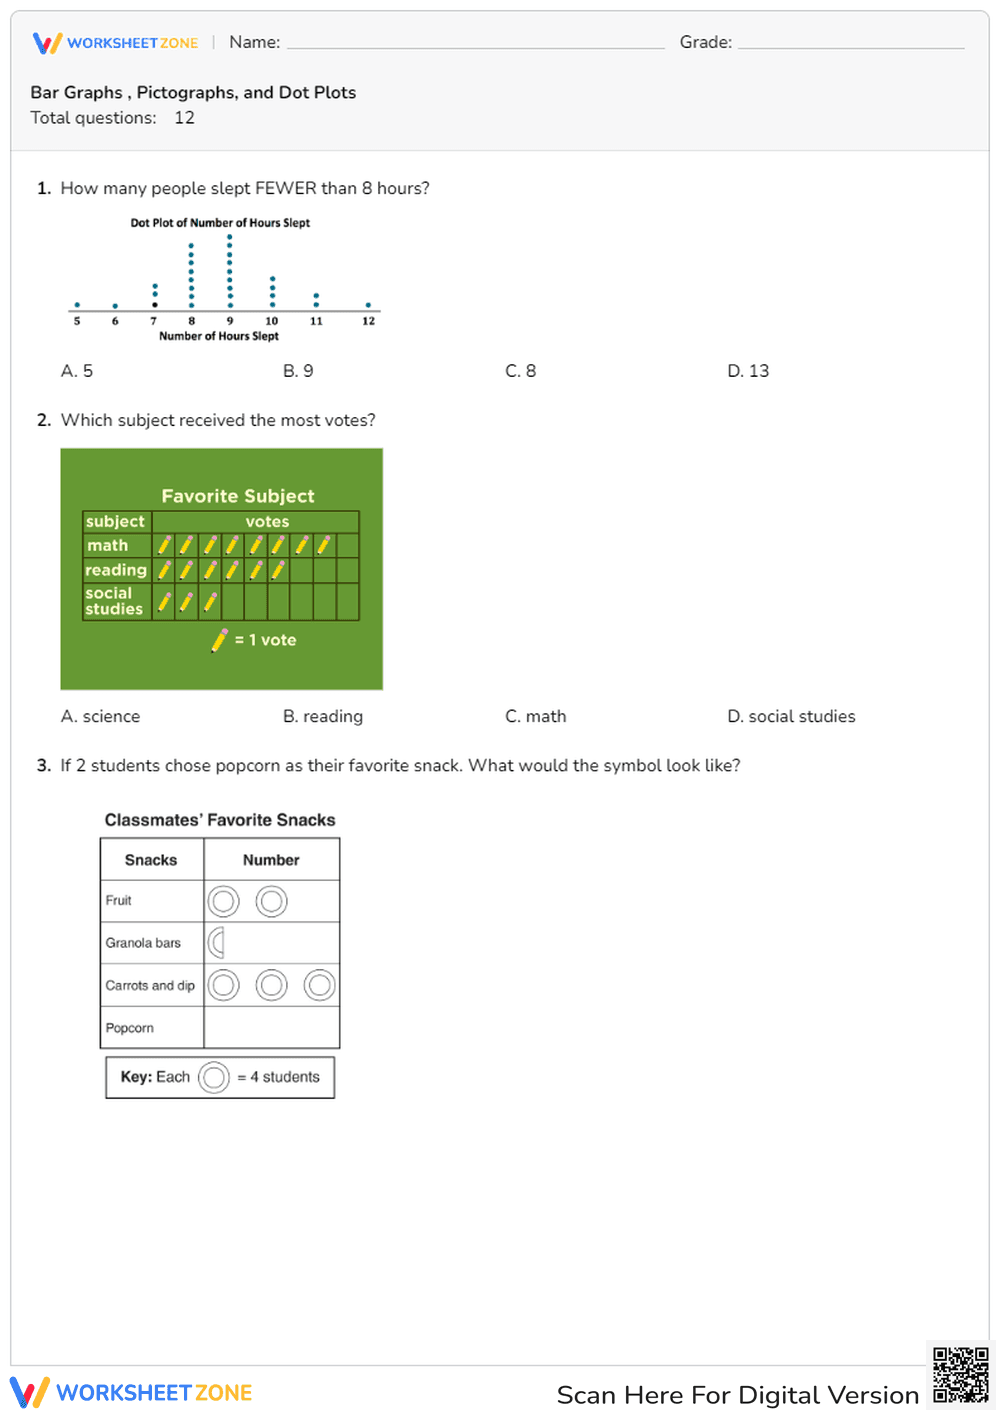
Data Interpretation Worksheet | Grade 5-6 Essential
Paste this activity's link or code into your existing LMS (Google Classroom, Canvas, Teams, Schoology, Moodle, etc.).
Students can open and work on the activity right away, with no student login required.
You'll still be able to track student progress and results from your teacher account.
This Grade 5 and 6 math worksheet provides comprehensive practice in data interpretation across multiple visual formats. Students analyze complex datasets to extract meaningful information and solve real-world problems. By engaging with varied representations, learners build the critical thinking skills necessary for advanced statistical reasoning and mathematical literacy in middle school.
At a Glance
- Grade: 5-6 · Subject: Math
- Standard:
CCSS.MATH.CONTENT.5.MD.B.2— Make a line plot to display a data set of measurements- Skill Focus: Interpreting multi-modal data displays
- Format: 4 pages · 12 problems · Answer key included · PDF
- Best For: Formative assessment or independent practice
- Time: 20–30 minutes
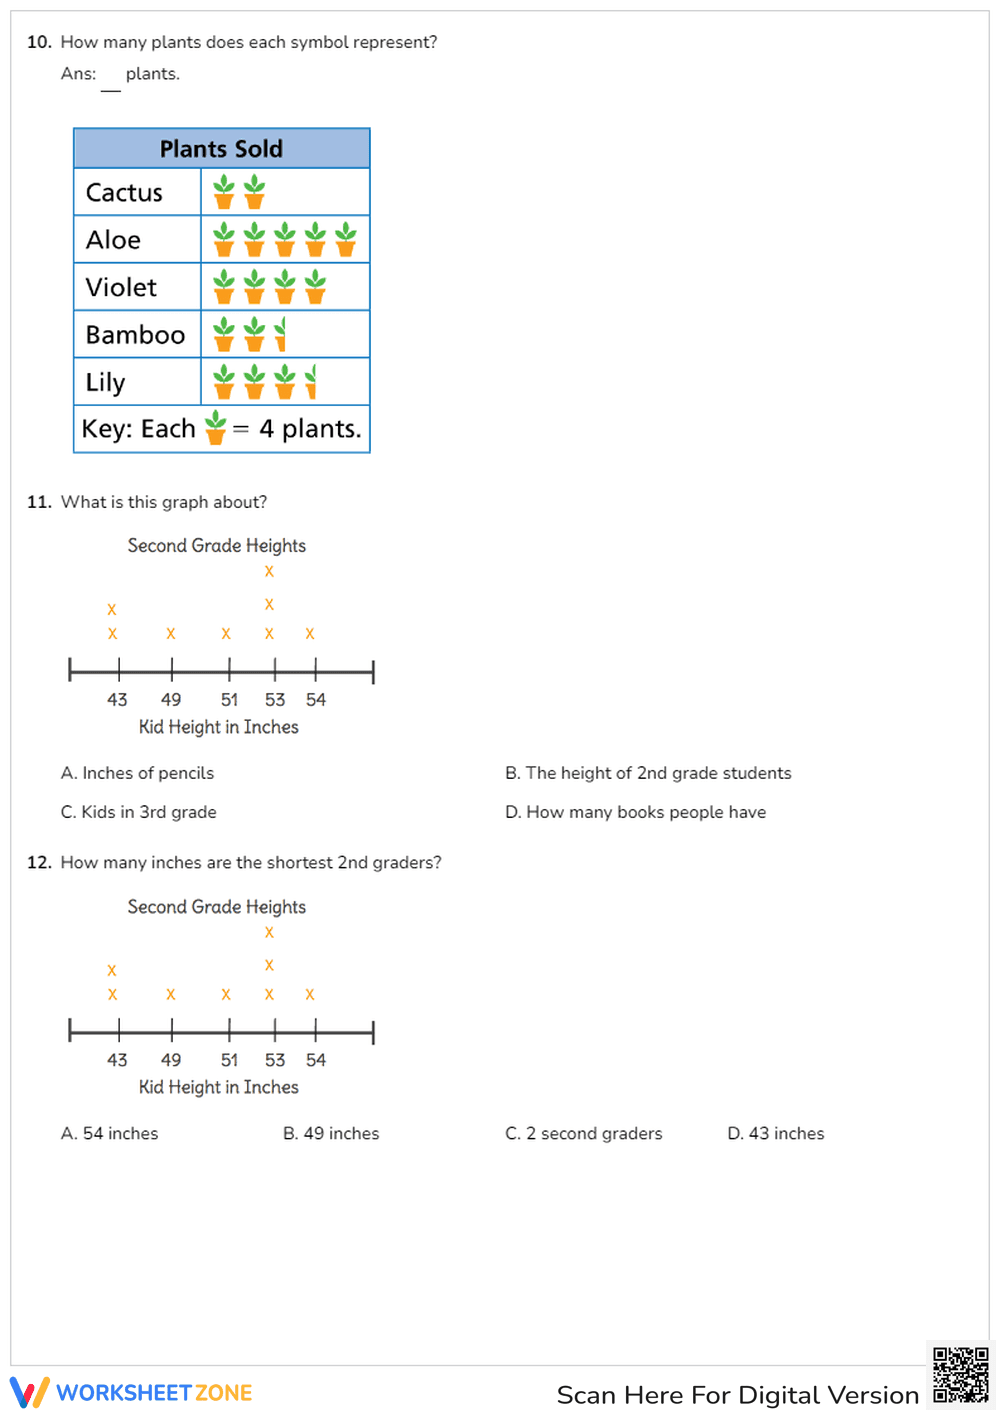
This 4-page PDF contains 12 structured multiple-choice and fill-in-the-blank questions. The resource features high-quality graphics including dot plots, tally charts, bar graphs, and scaled pictographs. Each section includes a clear key or scale, such as "Each symbol = 4 plants," ensuring students practice the essential step of decoding visual legends before performing calculations.
Skill Progression
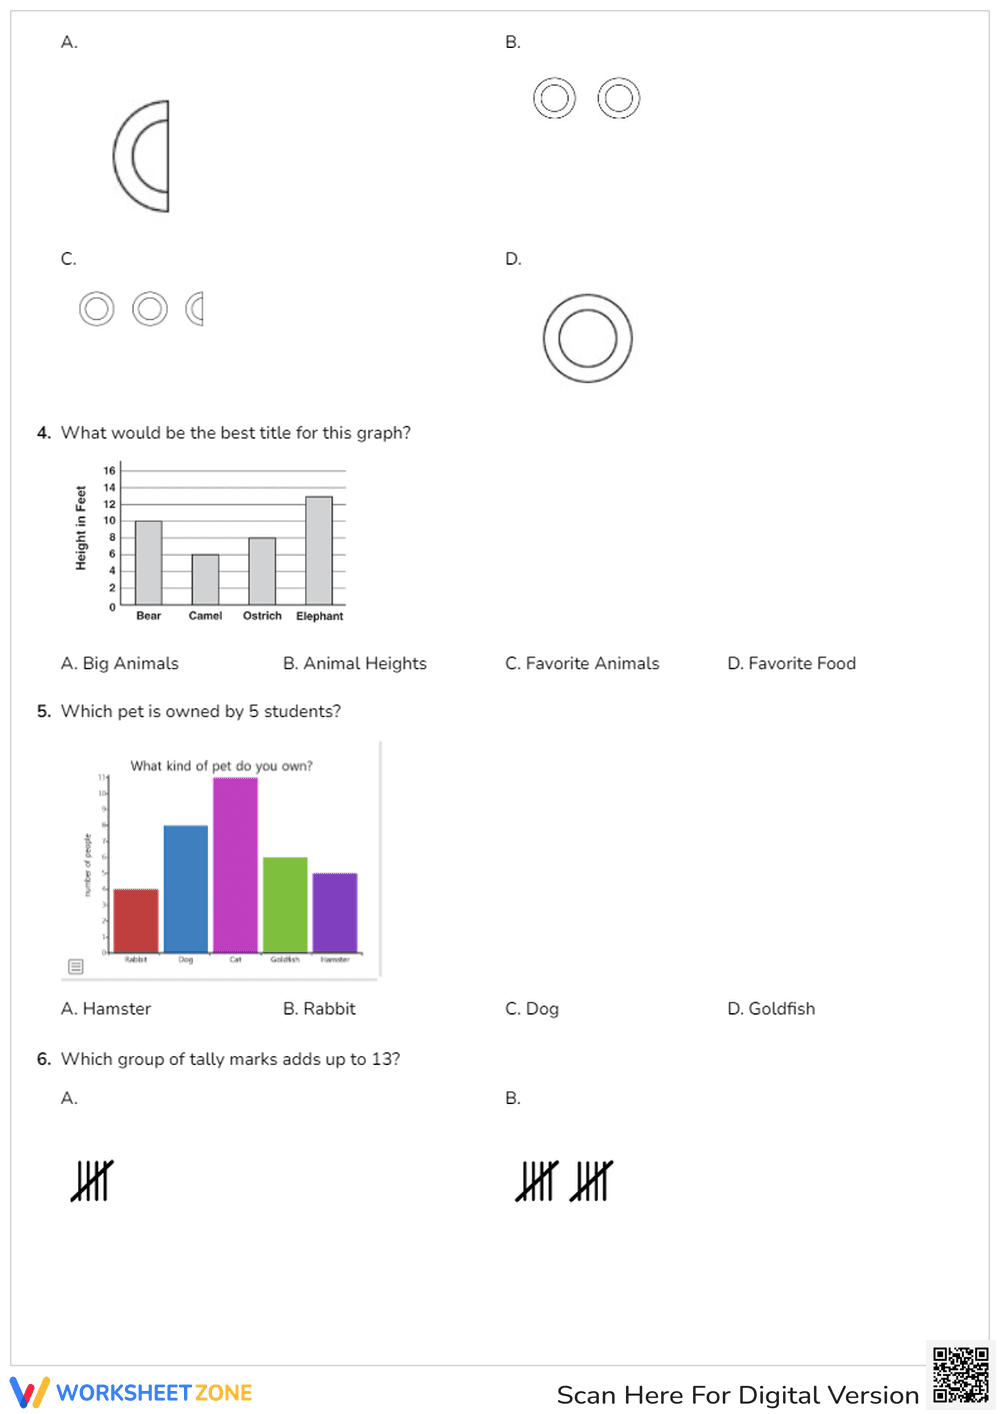
- Guided Practice: Questions 1-4 focus on direct identification and simple decoding using visual keys and tally marks to establish foundational accuracy.
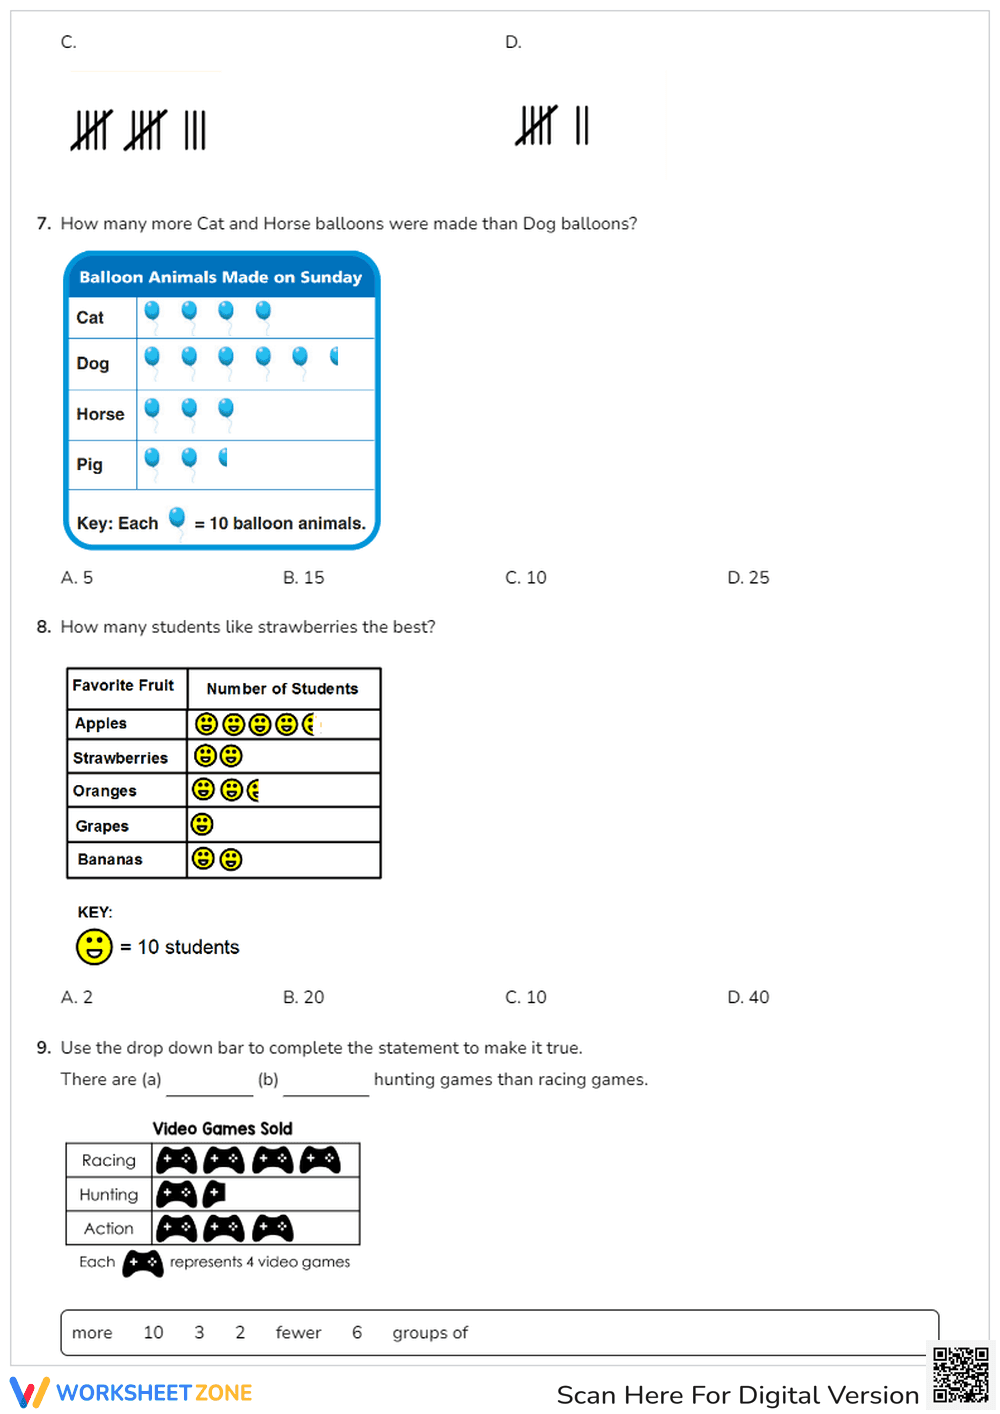
- Supported Practice: Questions 5-8 require multi-step calculations, such as comparing totals across categories or interpreting fractional symbols in pictographs.
- Independent Practice: Questions 9-12 challenge students to interpret dot plots and determine specific values like the shortest or tallest measurements in a set.
This sequence follows a gradual-release model to ensure students move from basic recognition to complex analysis.
Standards Alignment
This resource is aligned to CCSS.MATH.CONTENT.5.MD.B.2, which focuses on representing and interpreting data. It also supports CCSS.MATH.CONTENT.6.SP.B.4 by requiring students to display and read numerical data in plots on a number line. Both standard codes can be copied directly into lesson plans, IEP goals, or district curriculum mapping tools.
How to Use It
Use this worksheet as a mid-unit formative assessment to identify students struggling with scale factors in pictographs. It also serves as an excellent independent station activity during math rotations. Teachers should observe if students are correctly multiplying symbols by the key value. Completion typically ranges from 20 to 30 minutes depending on student proficiency.
Who It's For
This resource is designed for upper elementary and early middle school students who need to solidify their graphing skills. It is particularly helpful for visual learners and students requiring practice with multi-step data problems. Pair this with a hands-on data collection activity or a direct instruction lesson on frequency tables for a complete instructional cycle.
Research from RAND AIRS 2024 indicates that multi-modal data representation significantly improves student retention of statistical concepts compared to single-format instruction. This worksheet addresses that need by integrating four distinct graph types within a single 12-task sequence. By requiring students to interpret CCSS.MATH.CONTENT.5.MD.B.2 aligned dot plots and scaled pictographs, the material bridges the gap between basic counting and proportional reasoning. The inclusion of varied scales and keys forces students to engage in active decoding, a skill identified by Fisher & Frey (2014) as essential for mathematical literacy. This structured approach ensures that Grade 5 and 6 learners develop the fluency required for the more abstract data analysis found in high-stakes testing and secondary mathematics. Accessing these high-quality, printable materials allows educators to provide rigorous, standards-based practice without the burden of manual content creation.