


0
Views
0
Downloads
0.0
0
Save
0 Likes
Constant of Proportionality Worksheet
0 Views
0 Downloads
Paste this activity's link or code into your existing LMS (Google Classroom, Canvas, Teams, Schoology, Moodle, etc.).
Students can open and work on the activity right away, with no student login required.
You'll still be able to track student progress and results from your teacher account.
Information
Description
What It Is:
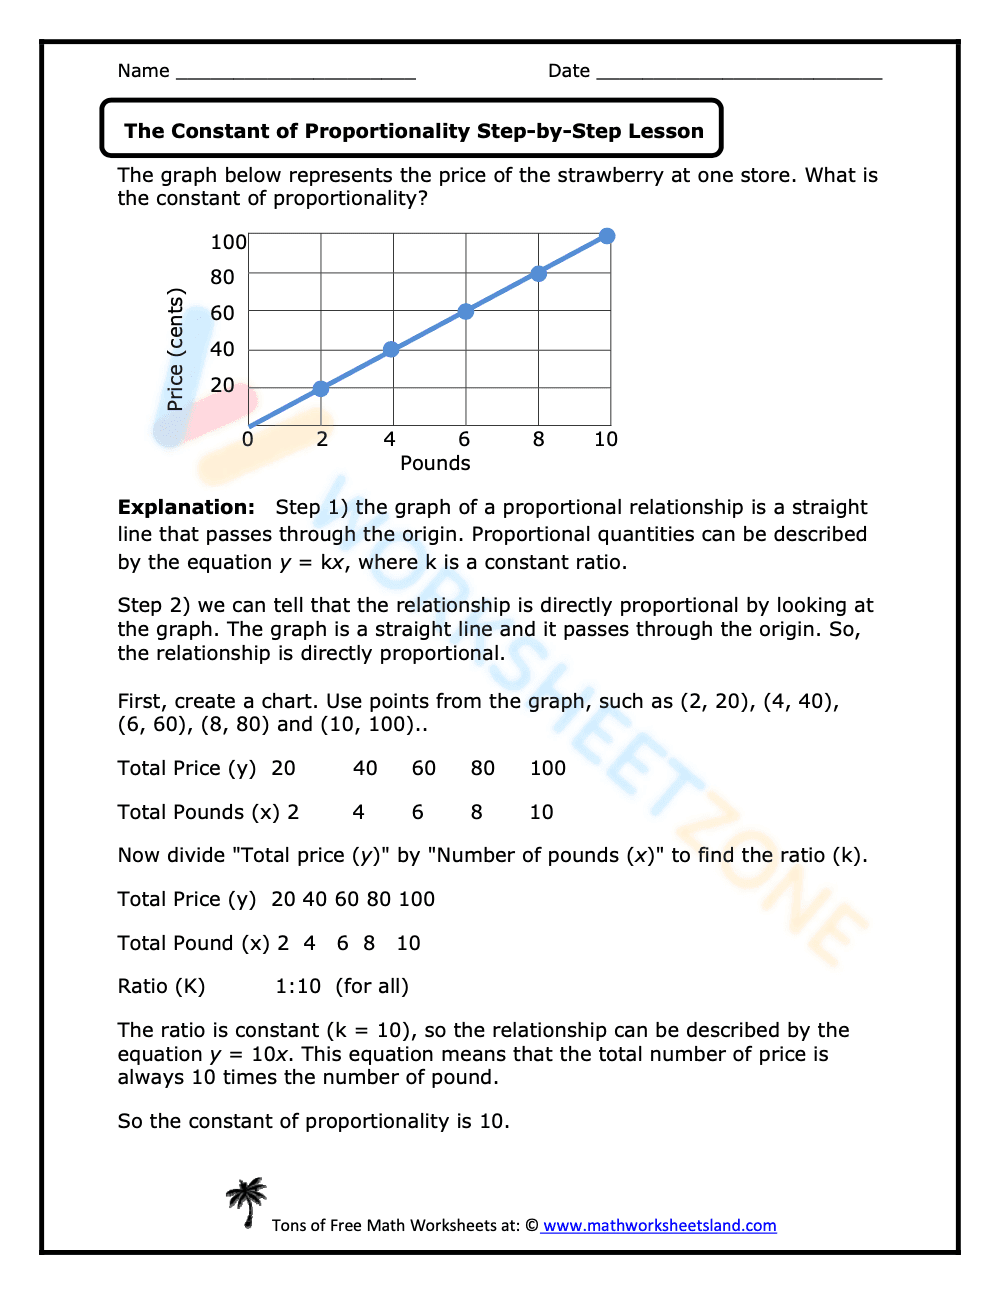
This is a math worksheet focusing on the concept of constant of proportionality. It presents a graph showing the relationship between the price of strawberries (in cents) and the number of pounds. The worksheet provides a step-by-step explanation of how to determine the constant of proportionality from the graph. It guides the student to create a chart using points from the graph, divide the total price by the number of pounds, and identify the constant ratio (k). The worksheet then explains how the relationship can be expressed as an equation (y = kx).
Grade Level Suitability:
This worksheet is suitable for grades 6-8. It involves understanding graphs, ratios, and algebraic relationships, which are typically introduced in these grade levels. The step-by-step instructions and example problem make it accessible for students learning about proportionality.
Why Use It:
This worksheet helps students understand the concept of constant of proportionality through a visual representation (graph) and a step-by-step problem-solving approach. It reinforces the connection between graphs, ratios, and equations, enhancing students' algebraic thinking and problem-solving skills. It uses a real-world example (price of strawberries) to make the concept relatable.
How to Use It:
Students should first read the problem statement and examine the provided graph. They should then follow the step-by-step explanation to create a chart of values from the graph, divide the total price by the number of pounds to find the ratio, and identify the constant of proportionality (k). Finally, they can express the relationship as an equation (y = kx).
Target Users:
This worksheet is ideal for students learning about ratios, proportions, and linear relationships. It is also helpful for students who need extra practice in interpreting graphs and applying algebraic concepts to real-world problems. It can be used in a classroom setting, as homework, or for independent study.