


Views
Downloads


Essential Grade 7 Constant of Proportionality Table Worksheet
Paste this activity's link or code into your existing LMS (Google Classroom, Canvas, Teams, Schoology, Moodle, etc.).
Students can open and work on the activity right away, with no student login required.
You'll still be able to track student progress and results from your teacher account.
Mastery of proportional relationships starts with identifying the unit rate within structured data. This comprehensive Grade 7 math worksheet provides targeted practice for students to calculate the constant of proportionality (k) from various tables. Students move from simple integer ratios to more complex decimal and fractional relationships, ensuring a deep conceptual understanding of the proportional equation y = kx.
At a Glance
- Grade: 7 · Subject: Math
- Standard:
7.RP.A.2.B— Identify the constant of proportionality in tables and proportional equations- Skill Focus: Constant of Proportionality (k) Calculation
- Format: 5 pages · 13 problems · Answer key included · PDF
- Best For: Guided practice or homework for ratios
- Time: 30–45 minutes
What's Inside
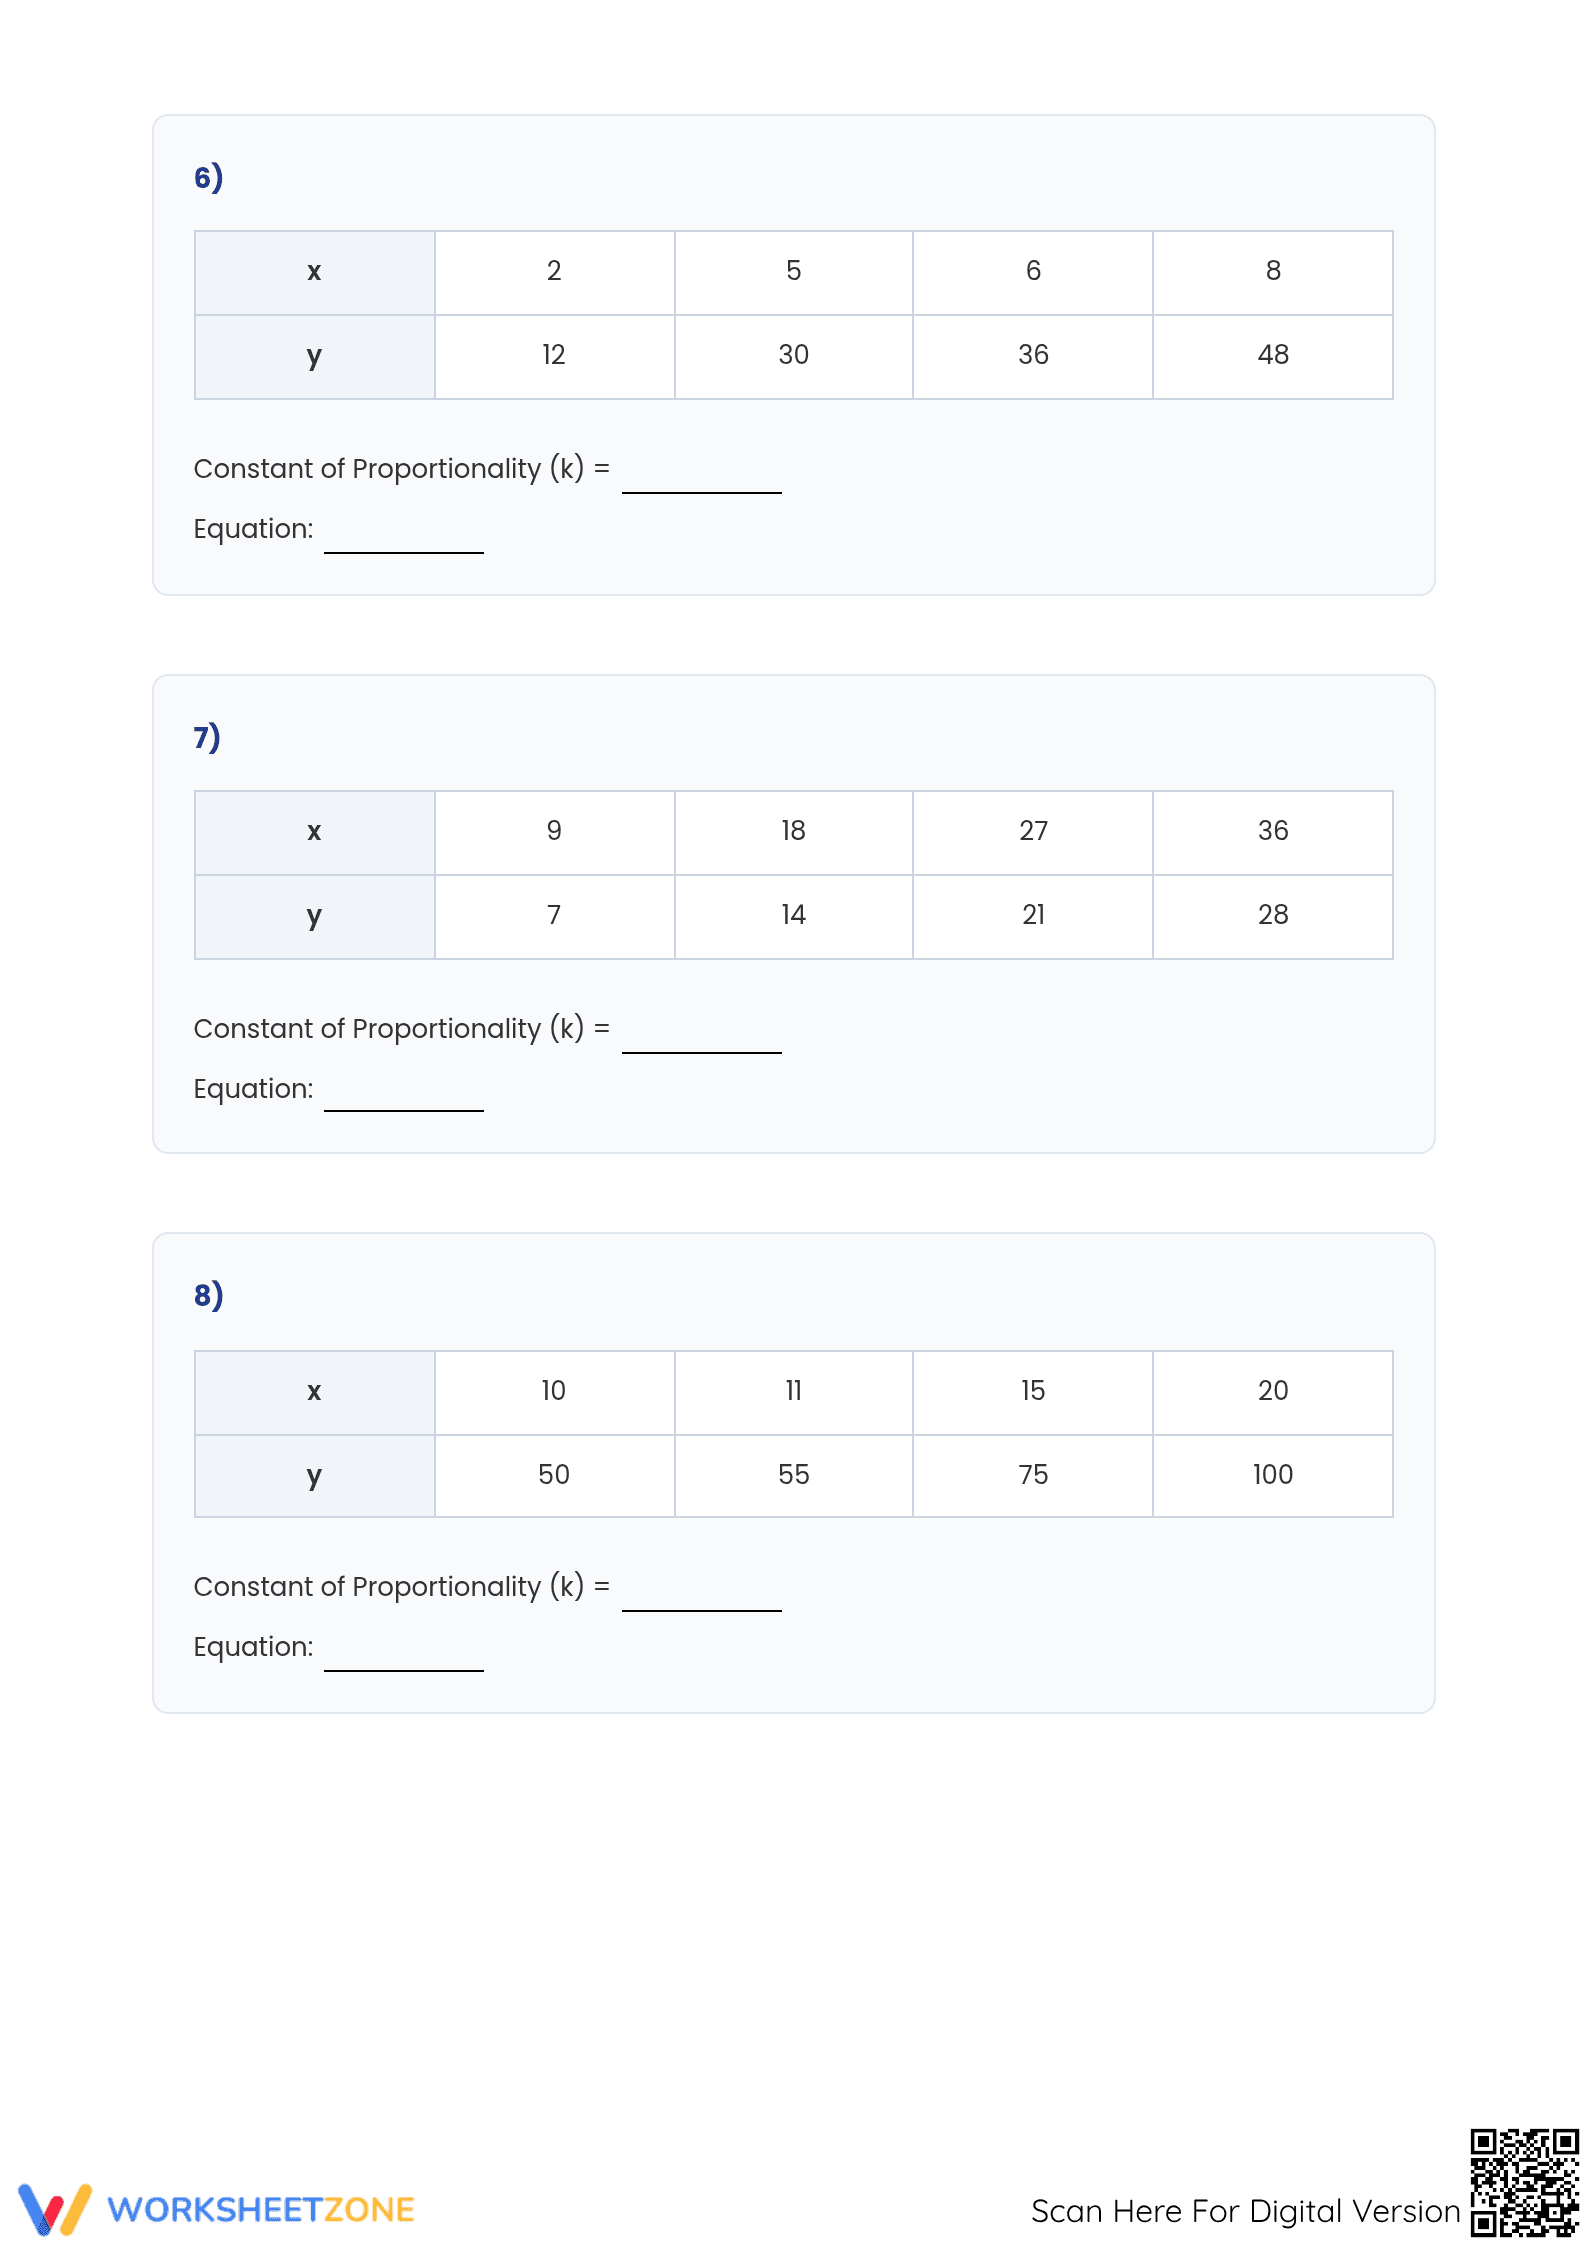
This five-page instructional packet contains 13 unique tables designed to strengthen algebraic thinking. The worksheet is divided into three logical sections: identifying constants from whole numbers, calculating constants from decimals and fractions, and advanced data sets. Each problem includes dedicated workspace for calculating k = y/x and writing the final proportional equation. A full five-page answer key is included for rapid grading.
Skill Progression
- Guided Practice: Problems 1–4 provide basic integer tables where the constant is easily observable, allowing students to build confidence in the k = y/x formula.
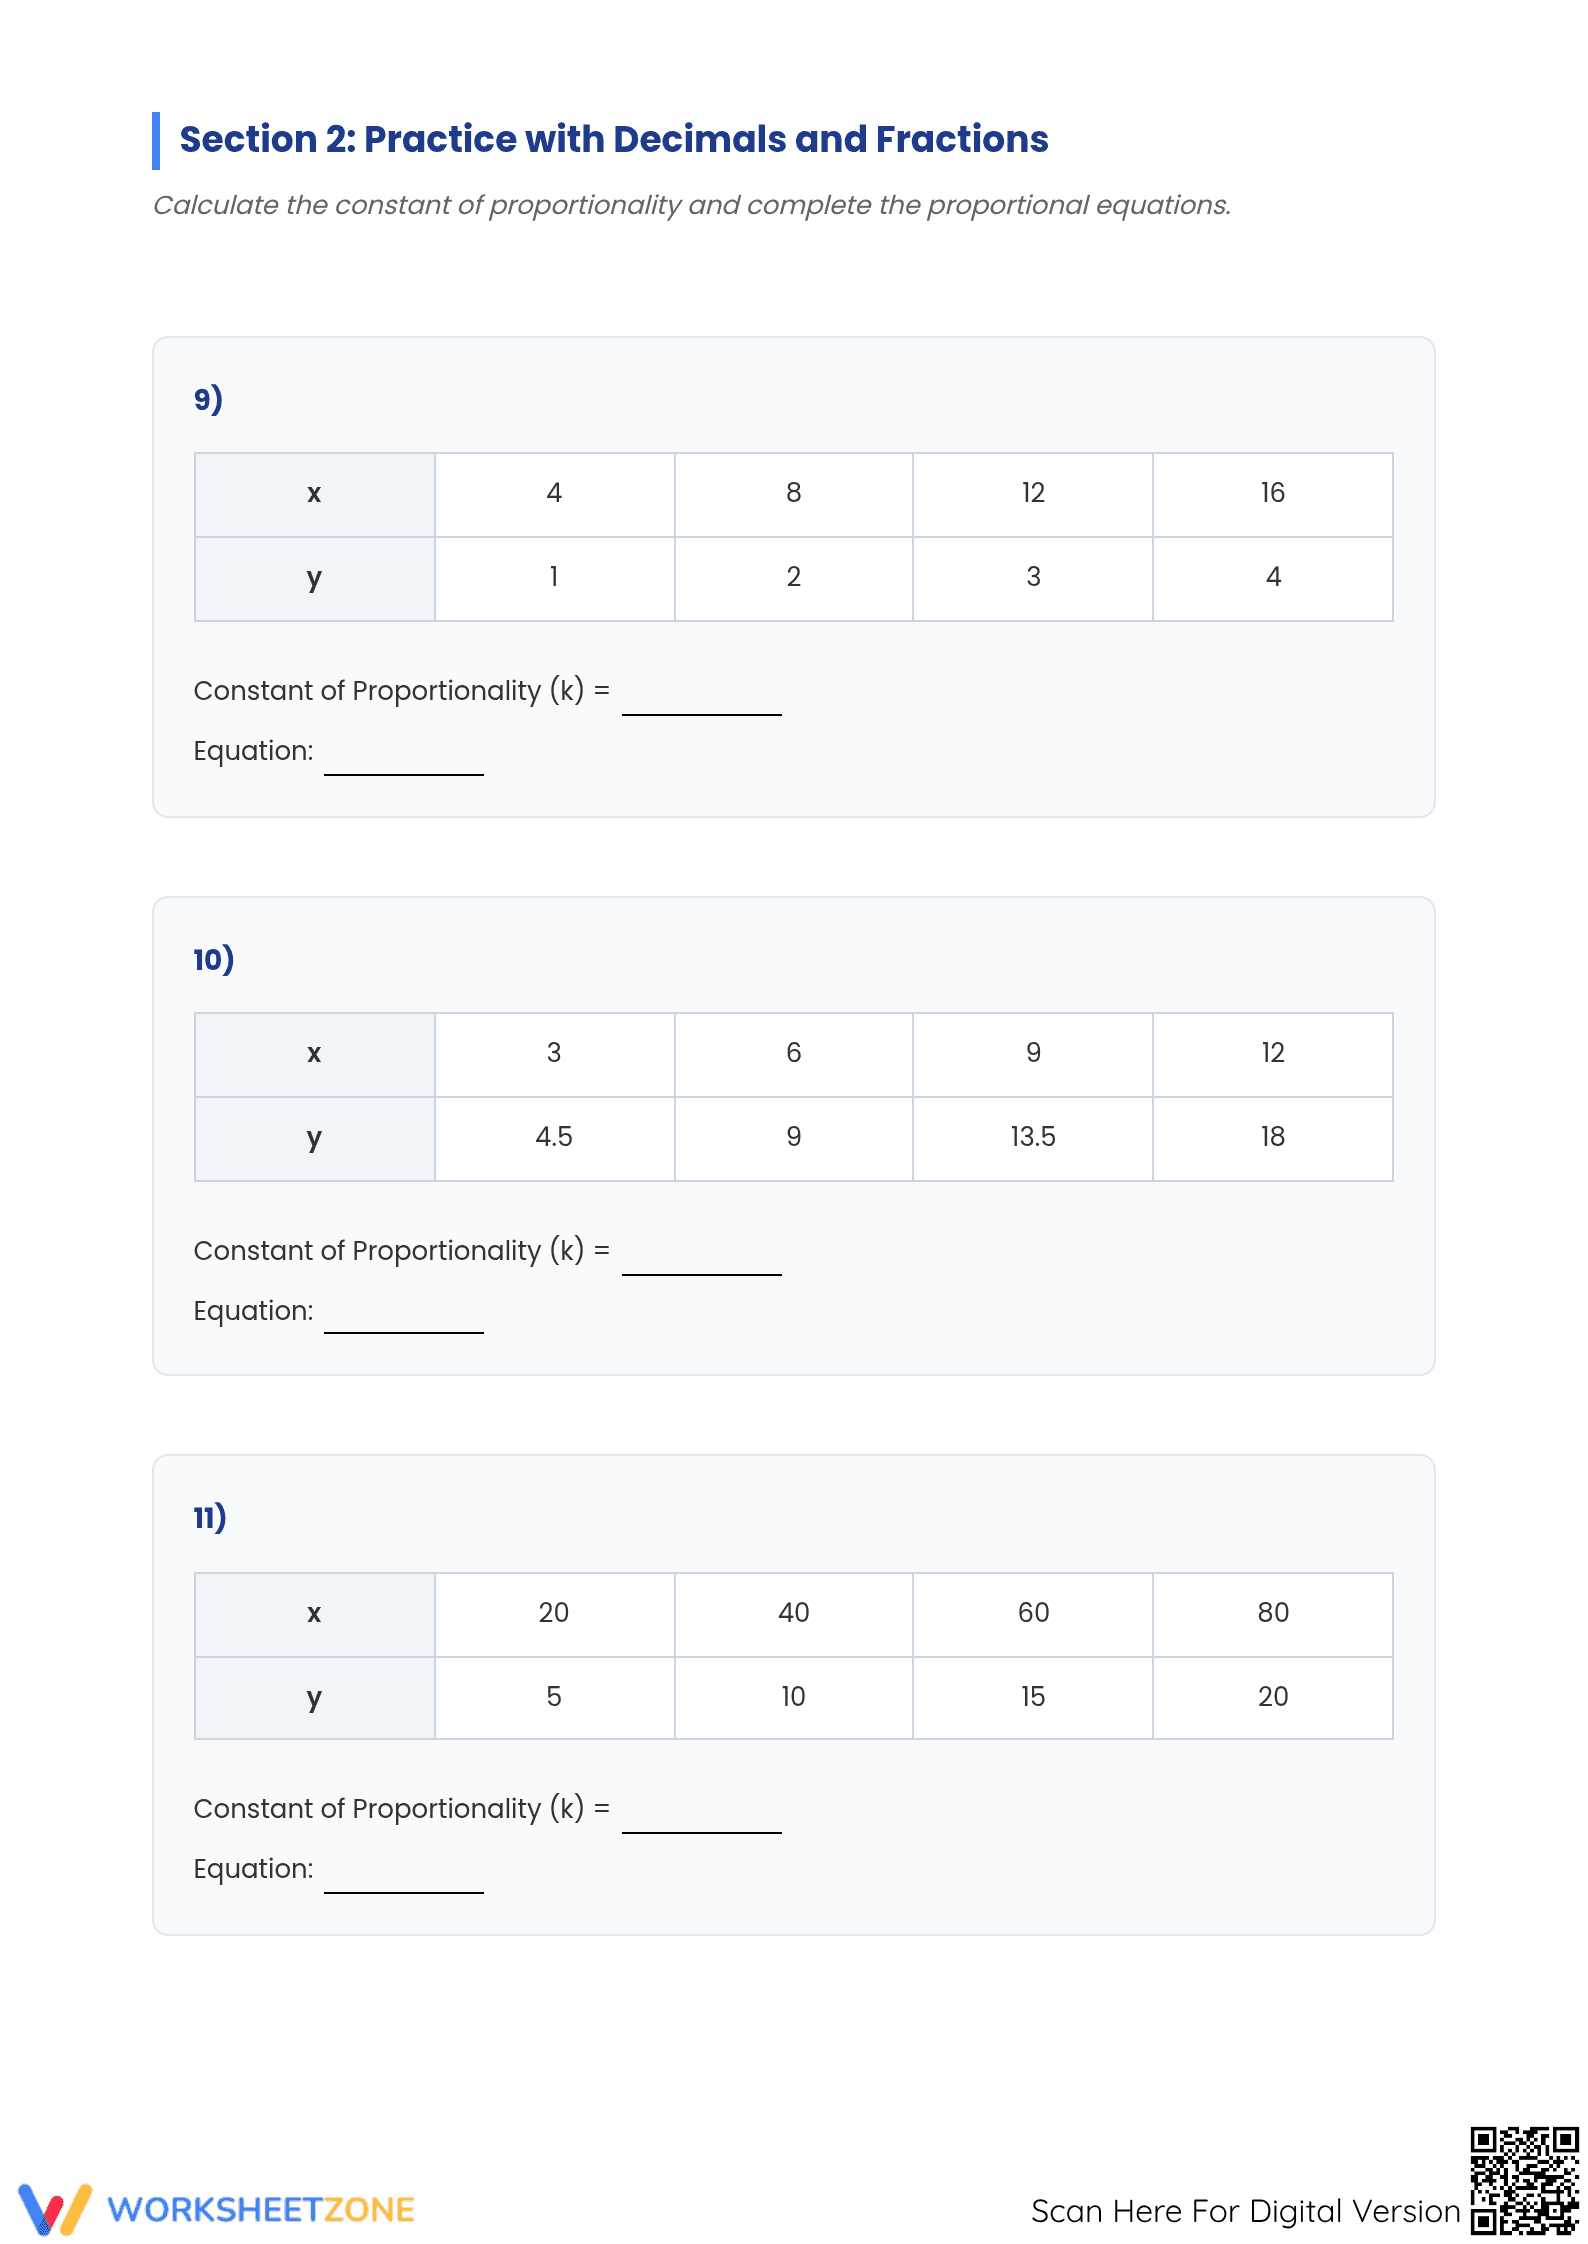
- Supported Practice: Problems 5–12 introduce decimals and fractional outputs, requiring students to apply division algorithms while maintaining the proportional structure.
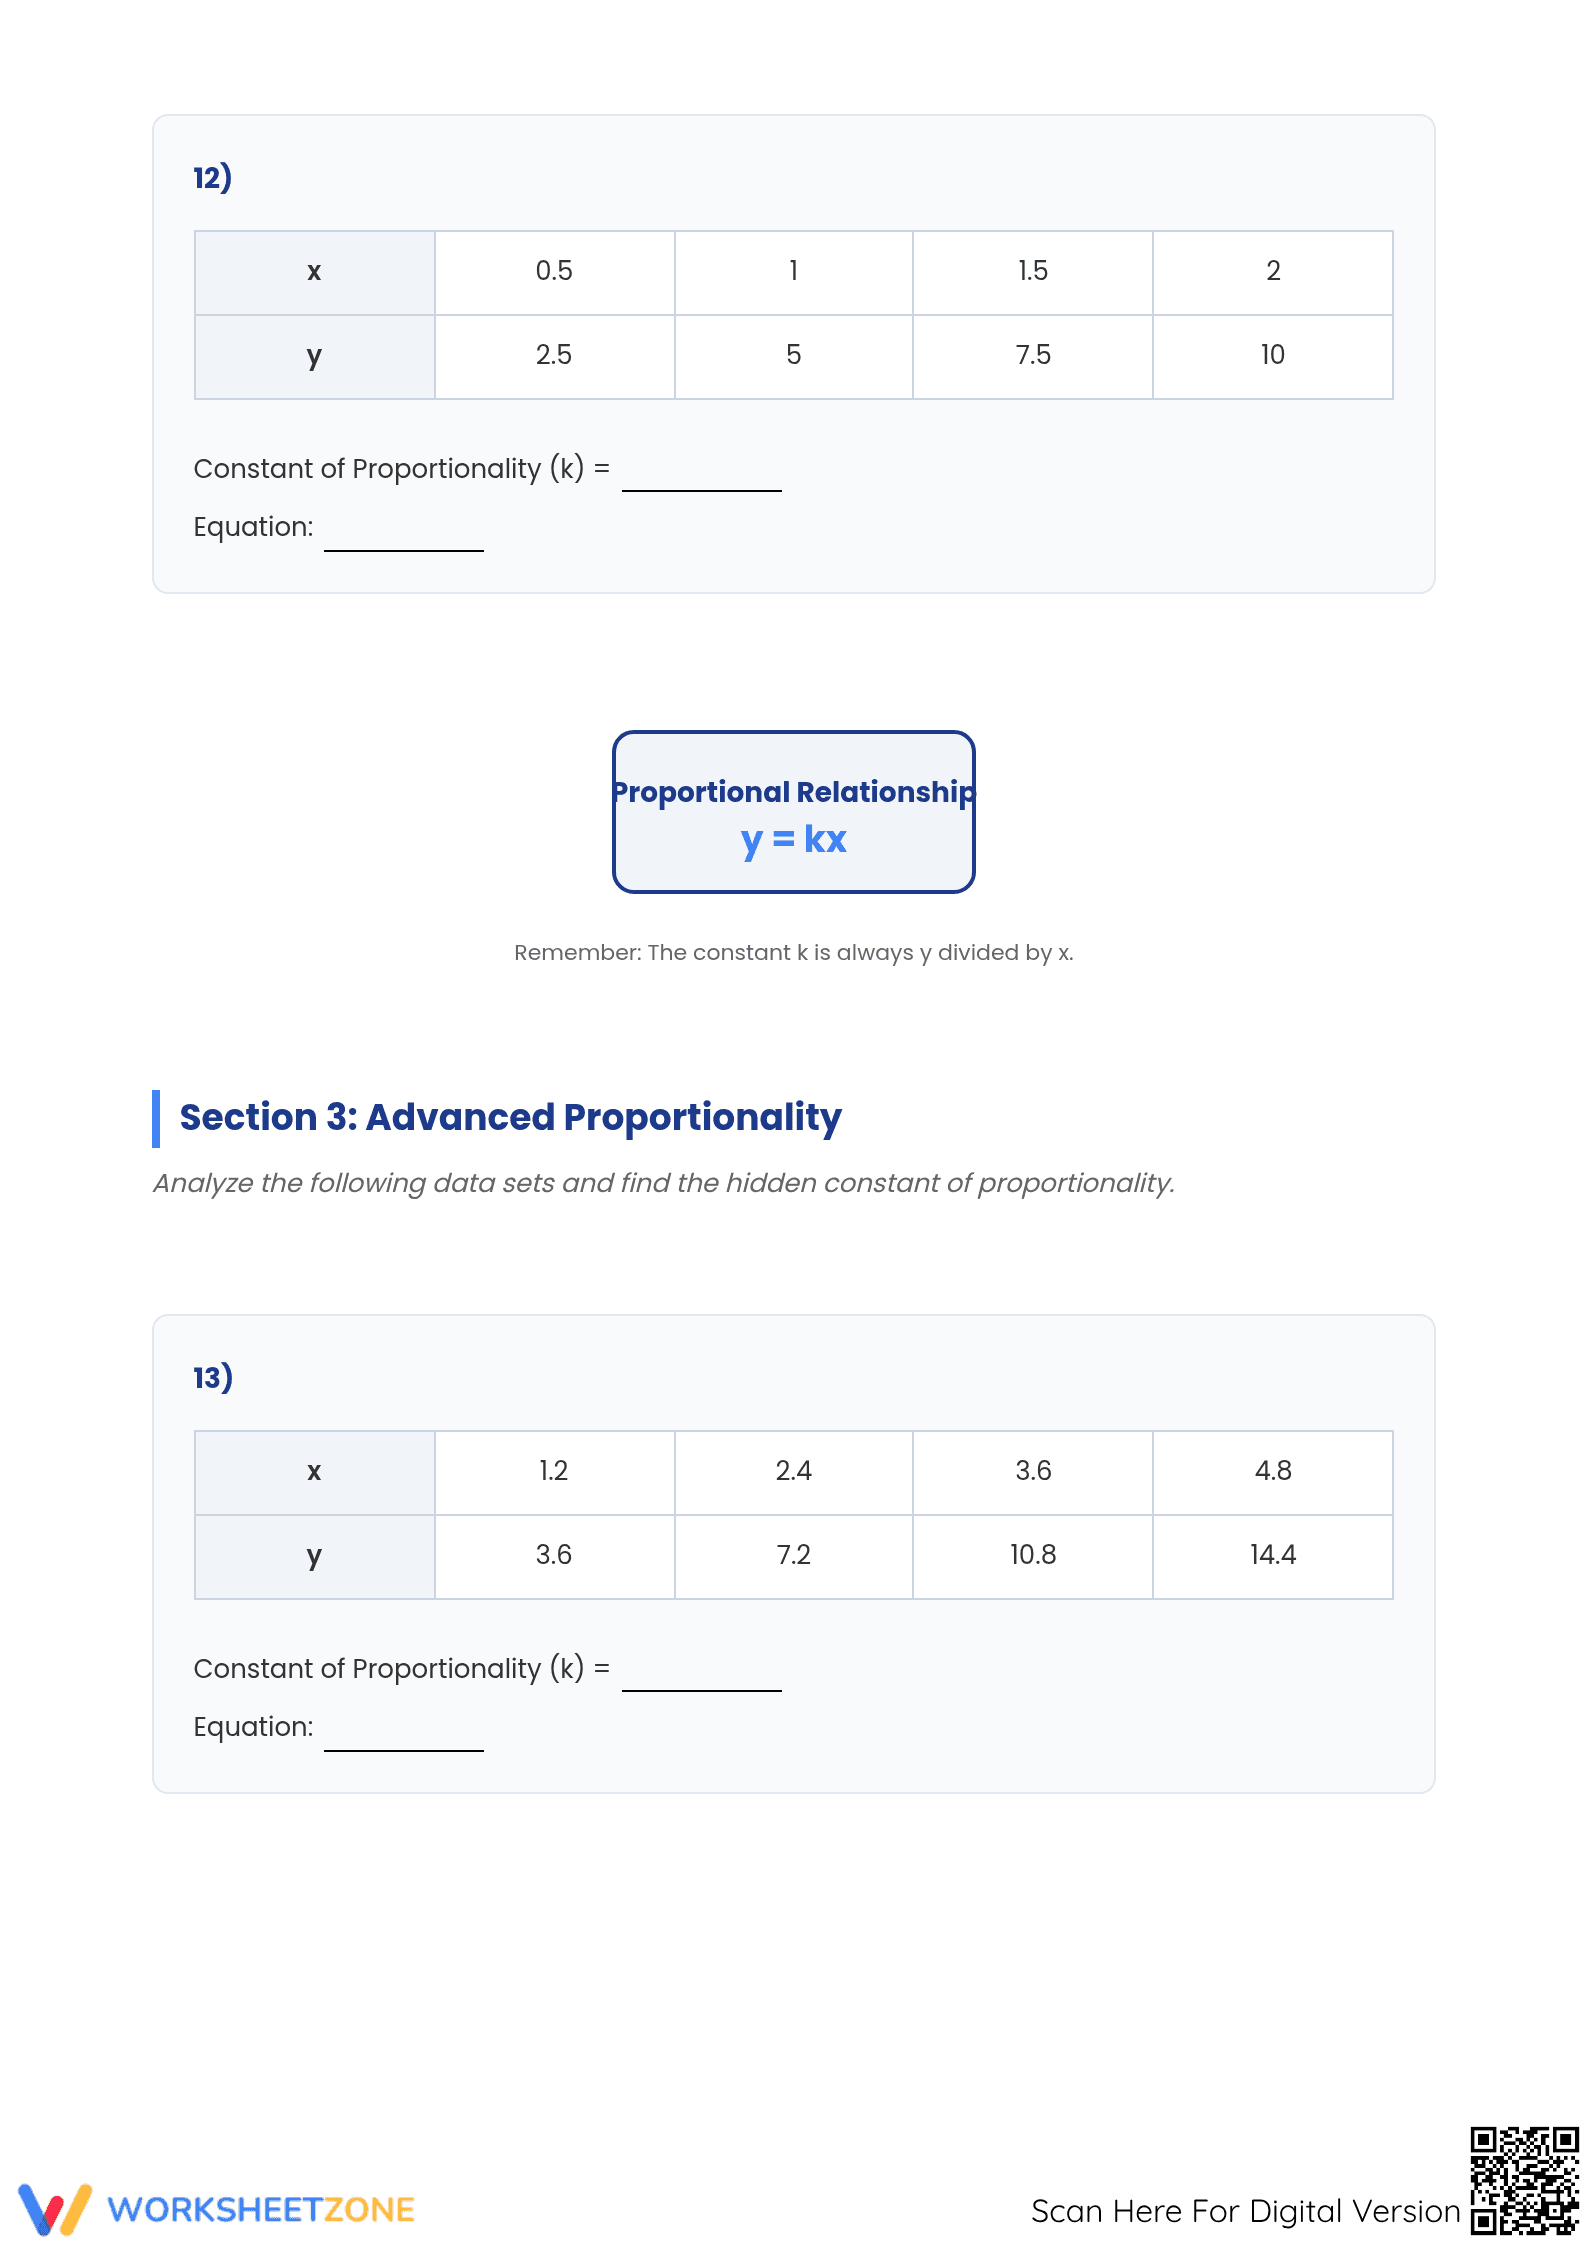
- Independent Practice: The final section presents hidden constants within more complex data sets, challenging students to verify proportionality across all table entries independently.
Standards Alignment
This resource is strictly aligned to 7.RP.A.2.B: "Identify the constant of proportionality (unit rate) in tables, graphs, equations, diagrams, and verbal descriptions of proportional relationships." It also supports 7.RP.A.2.C by requiring students to represent relationships by equations. These codes can be copied directly into lesson plans, IEP goals, or district curriculum mapping tools.
How to Use It
Deploy this worksheet immediately following a direct instruction lesson on unit rates. Use the first page as a guided practice session to model the division of y by x. For a formative assessment tip, observe students during Section 2 to see if they consistently apply the formula to multiple rows in the table. This packet typically takes 30 to 45 minutes to complete.
Who It's For
This resource is ideal for Grade 7 students introduced to Ratios and Proportional Relationships, as well as Grade 8 and 9 students requiring remediation or RTI support. It pairs naturally with a unit on graphing linear equations or a supplemental reading on real-world rate applications. The clear layout supports students with executive functioning challenges by providing predictable task structures.
According to the RAND AIRS 2024 report, high-quality instructional materials that emphasize the structural properties of ratios—specifically the identification of the constant of proportionality—significantly improve student readiness for eighth-grade algebra. This worksheet targets the exact skill of calculating k from tabular data, which is a foundational requirement of the 7.RP.A.2.B standard. By requiring both the calculation of the constant and the derivation of the equation y = kx, the resource bridges the gap between arithmetic ratios and algebraic functions. Research from Fisher & Frey (2014) suggests that this type of scaffolded practice, moving from whole numbers to rational numbers, is essential for internalizing the concept of a constant rate of change. This printable packet provides 13 distinct opportunities for students to engage with the math, ensuring they can accurately extract unit rates from structured data sets in preparation for more complex geometric and algebraic transformations in high school.