


























Views
Downloads


Complete Population Dynamics Worksheet | Grade 10 Biology
Paste this activity's link or code into your existing LMS (Google Classroom, Canvas, Teams, Schoology, Moodle, etc.).
Students can open and work on the activity right away, with no student login required.
You'll still be able to track student progress and results from your teacher account.
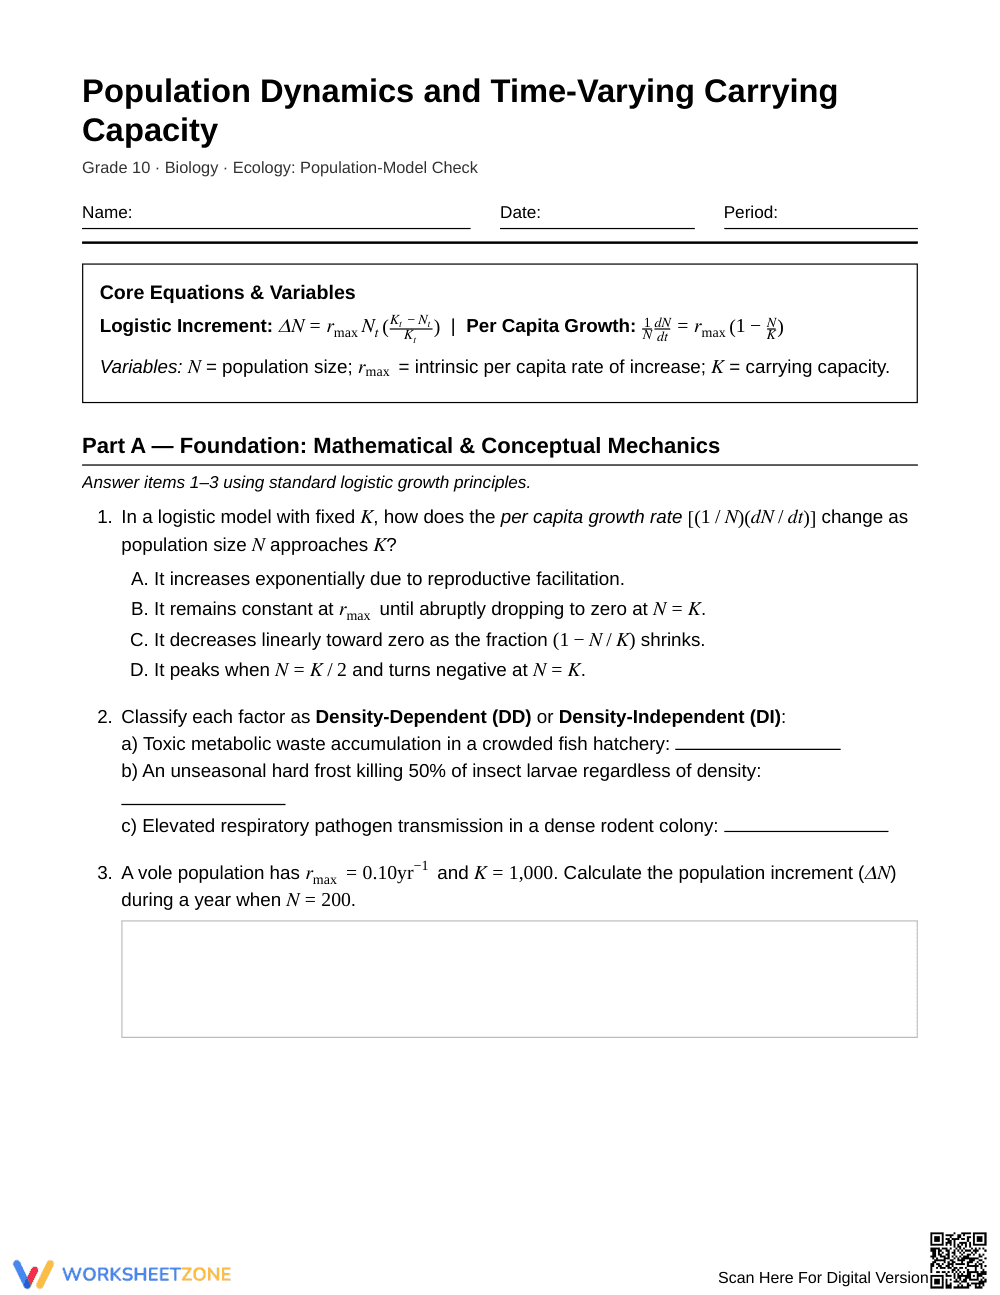
This Grade 10 biology worksheet provides structured quantitative practice evaluating carrying capacity and population dynamics models. Students analyze mathematical logistic equations, interpret multi-season demographic datasets, and modify biological models to account for dynamic limiting factors such as thermal stress and resource depletion.
At a Glance
- Grade: 10 · Subject: Biology
- Standard: High School Life Science — Model carrying capacity and dynamic limiting factors in ecosystems
- Skill Focus: Population Dynamics & Carrying Capacity Models
- Format: 5 pages · 12 problems · Answer key included · PDF
- Best For: Quantitative ecology and population modeling practice
- Time: 45–60 minutes
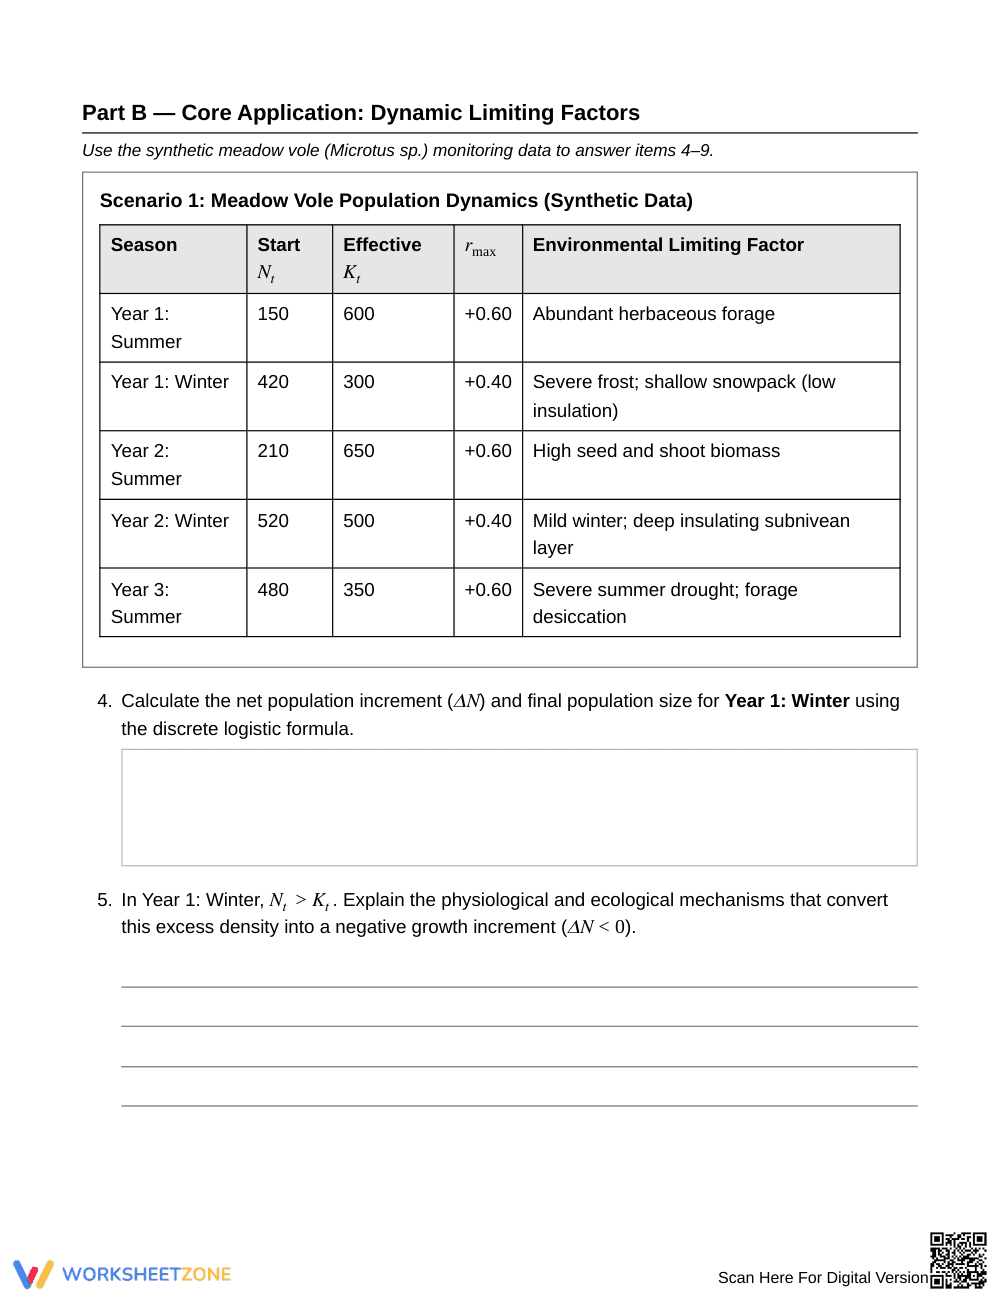
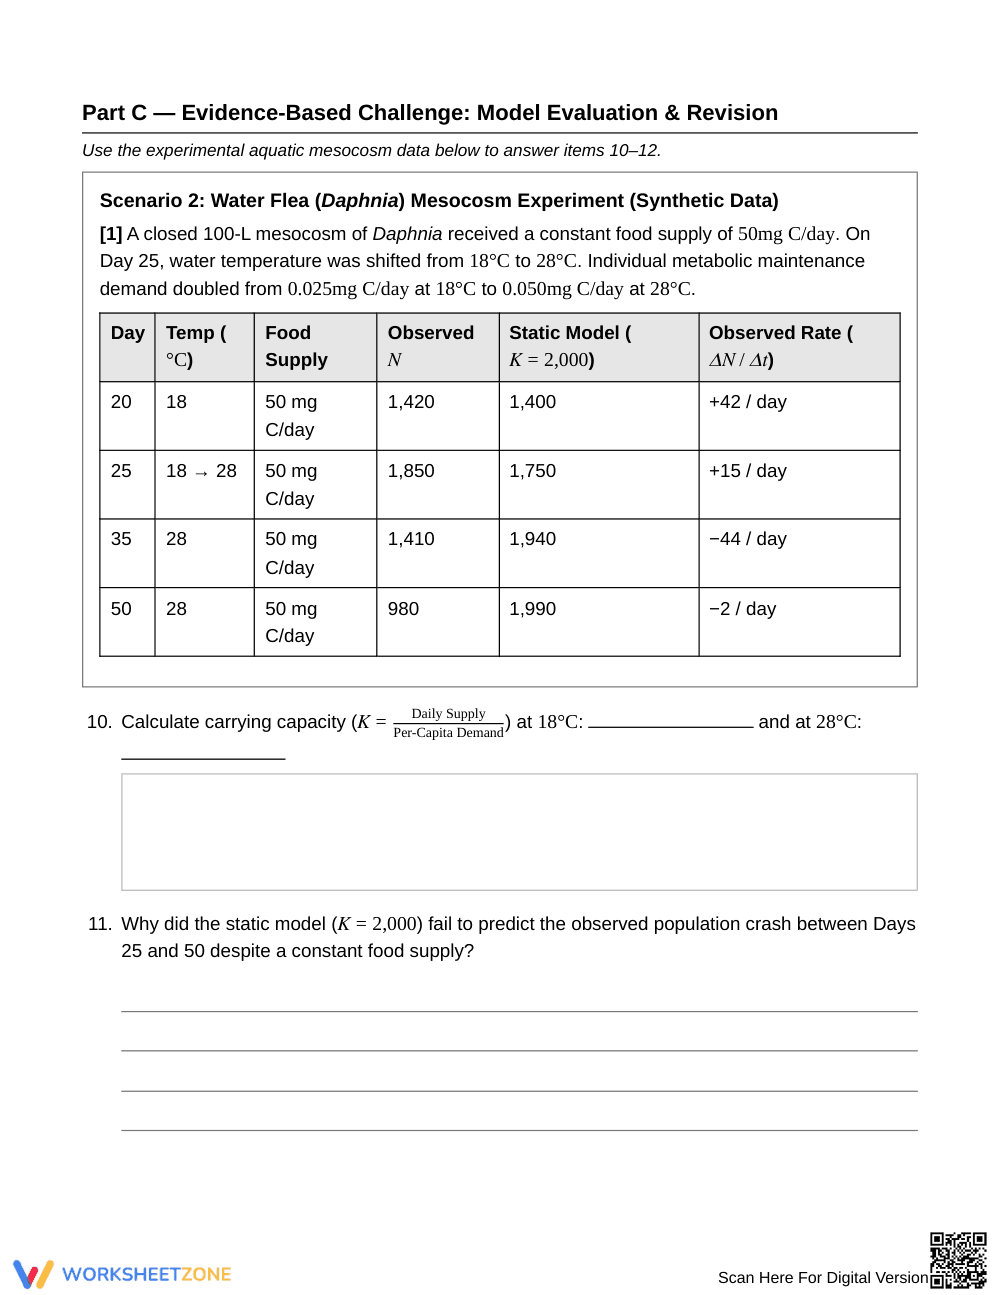
Across 5 printable pages, this resource features 12 multi-part analytical items organized into three targeted sections. Students interact with core logistic formulas, multi-year meadow vole monitoring tables, and controlled aquatic mesocosm datasets. A complete 2-page answer key provides full step-by-step mathematical calculations and explanatory physiological keys.
Skill Progression
- Guided Practice (Items 1–3): Students review core variables, classify density-dependent versus density-independent limiting factors, and compute baseline logistic population increments using provided formulas.
- Supported Practice (Items 4–9): Students interpret synthetic vole monitoring data across seasonal fluctuations, calculate negative growth increments when density exceeds capacity, and analyze lag times.
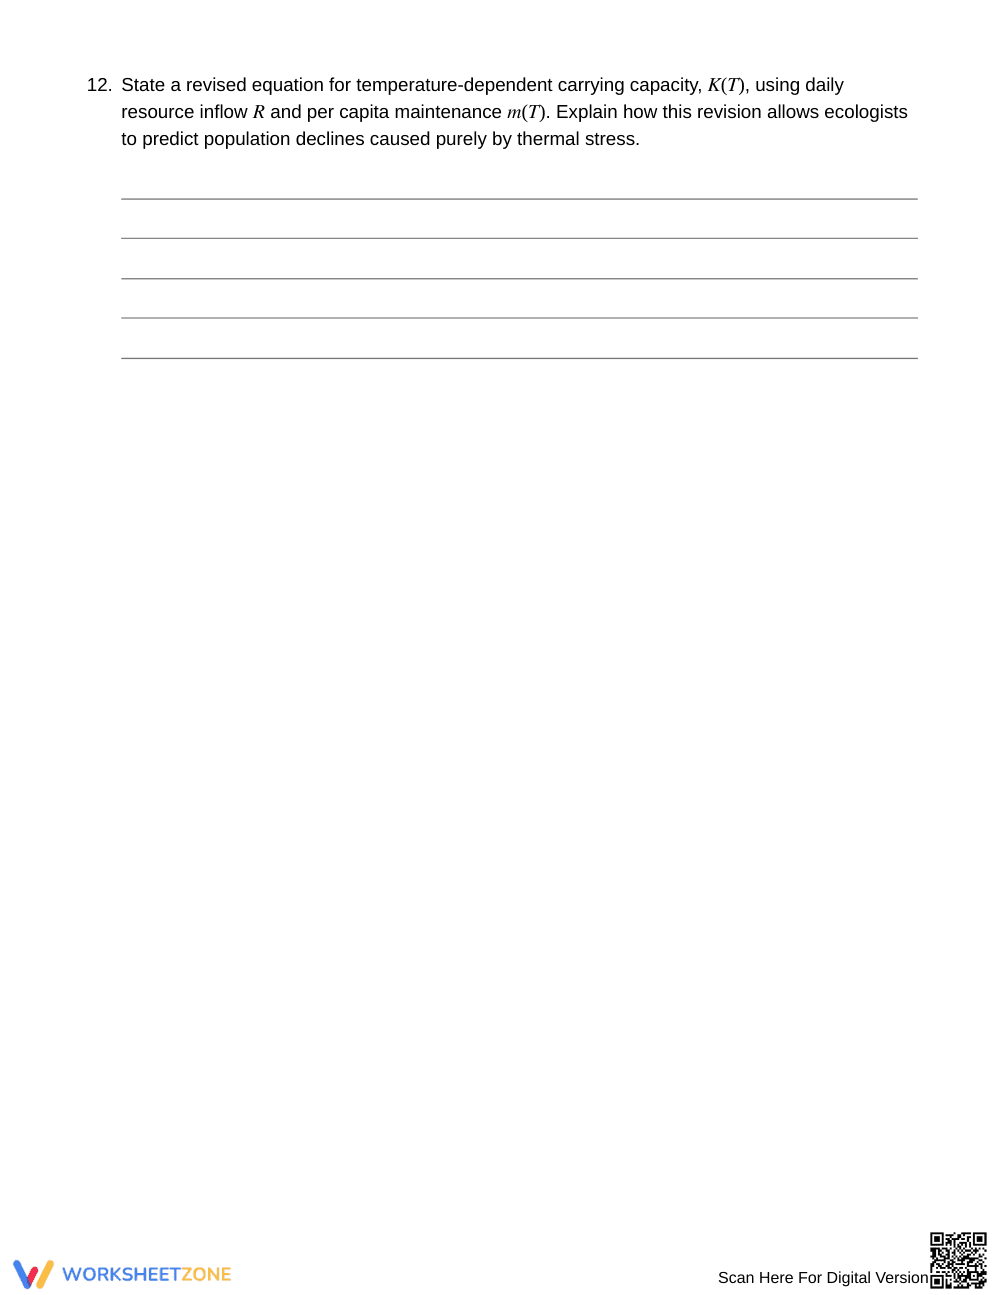
- Independent Application (Items 10–12): Students evaluate experimental Daphnia mesocosm data under thermal shifts, diagnose static model failure, and formulate revised equations.
This gradual-release structure builds foundational algebraic literacy before requiring high-order biological synthesis and model revision.
Standards Alignment
This resource aligns with High School Life Science standards addressing ecosystem interactions and population ecology. Students use mathematical representations to support explanations of factors affecting carrying capacity and population growth across trophic systems. Both standard codes can be copied directly into lesson plans, IEP goals, or district curriculum mapping tools.
How to Use It
Deploy this worksheet after direct instruction on logistic growth curves and limiting factors. Alternatively, use it during an ecology unit review to prepare students for quantitative assessment items. While students work through Part B, observe whether they correctly assign a negative sign to the growth increment when population size exceeds carrying capacity. Plan for 45 to 60 minutes of focused classroom work.
Who It's For
This activity supports general Grade 10 Biology students, honors biology learners, and introductory AP Biology classes requiring rigorous computational ecology practice. For students needing scaffolding, provide a reference sheet of variable definitions. Pair this assignment with a lab simulation investigating nutrient limitation in aquatic micro-ecosystems.
Quantitative population modeling requires students to connect mathematical representations with underlying biological mechanisms. According to Fisher & Frey (2014), structured instructional scaffolds that transition students from foundational equation mechanics to authentic data interpretation significantly improve analytical proficiency in high school science. This Grade 10 ecology worksheet guides learners to compute logistic growth increments, distinguish density-dependent limiting factors, and evaluate how environmental variables alter carrying capacity over time. By working with synthetic ecological datasets, students identify why fixed-capacity models fail during acute thermal stress and drought conditions, directly reinforcing empirical reasoning. The progressive design provides targeted practice calculating per capita growth, explaining time lags, and formulating revised mathematical models based on dynamic resource availability. Incorporating explicit computational routines alongside conceptual analysis ensures that secondary biology students build the scientific literacy and problem-solving stamina necessary for advanced ecological coursework and standards mastery.


