


Views
Downloads
Water Cycle Infographic | Grade 6-7 Essential Guide
Paste this activity's link or code into your existing LMS (Google Classroom, Canvas, Teams, Schoology, Moodle, etc.).
Students can open and work on the activity right away, with no student login required.
You'll still be able to track student progress and results from your teacher account.
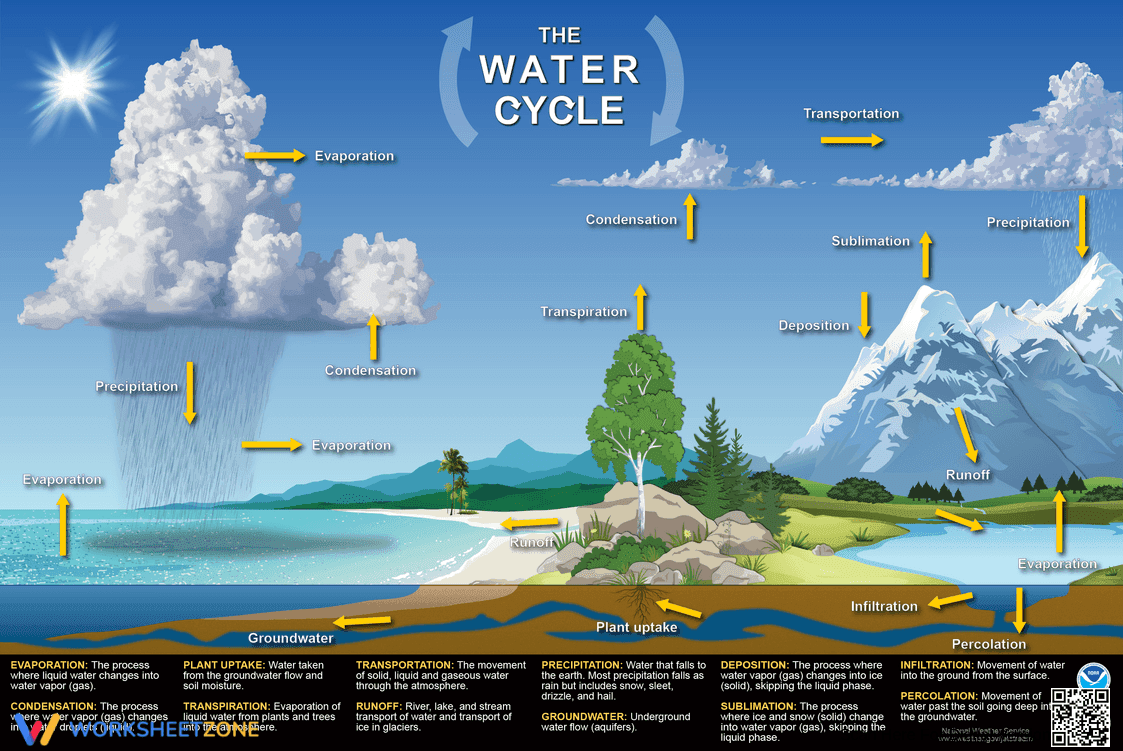
This Grade 6-7 water cycle infographic provides a comprehensive visual model of Earth's hydrologic processes. Students identify and define 12 critical stages, including sublimation and percolation, to understand how energy and gravity drive water movement. It serves as a foundational reference for mastering complex Earth science systems and ecosystem interactions.
At a Glance
- Grade: 6-7 · Subject: Science
- Standard:
MS-ESS2-4— Model the cycling of water through Earth's systems driven by sun and gravity- Skill Focus: Hydrologic cycle terminology and process modeling
- Format: 1 page · 12 defined terms · Reference Guide · PDF
- Best For: Interactive notebooks and classroom anchor charts
- Time: 10–15 minutes
What's Inside
This single-page PDF features a high-resolution, vibrant infographic illustrating the global water cycle. It includes 12 distinct labels mapped to specific geographic and atmospheric locations. Below the visual, a detailed glossary provides technical definitions for evaporation, condensation, precipitation, transpiration, transportation, runoff, infiltration, percolation, plant uptake, groundwater, deposition, and sublimation.
Zero-Prep Workflow
- Print: Download and print the high-resolution PDF or upload it to your digital learning management system in under 1 minute.
- Distribute: Hand out copies to students for inclusion in their science journals or interactive notebooks as a permanent reference.
- Review: Use the 12 key terms as a whole-class warm-up or as a visual aid during direct instruction on Earth systems.
This resource is an ideal "grab-and-go" tool for substitute teacher folders or last-minute lesson supplements.
Standards Alignment
The primary alignment is `MS-ESS2-4`, which requires students to develop a model to describe the cycling of water through Earth's systems. This infographic provides the necessary vocabulary and spatial relationships to build that conceptual model. It also supports MS-ESS2-1 by illustrating how Earth's processes are interconnected. Both standard codes can be copied directly into lesson plans, IEP goals, or district curriculum mapping tools.
How to Use It
Use this infographic during the "Explain" phase of a 5E lesson cycle to provide formal definitions after an initial inquiry activity. It is also effective as a formative assessment tool; ask students to cover the bottom definitions and explain the processes based only on the visual arrows. Expected completion for a labeling or notebooking activity is 10–15 minutes.
Who It's For
This resource is tailored for middle school students in Grade 6 and Grade 7 science classes. It is particularly helpful for English Language Learners (ELLs) and visual learners who benefit from the direct pairing of technical vocabulary with clear imagery. It pairs naturally with a water cycle simulation lab or a reading passage on weather patterns.
According to the RAND AIRS 2024 report, visual scaffolds like infographics significantly improve the retention of complex scientific cycles in middle school learners. This resource targets MS-ESS2-4 by providing a clear, labeled model of the water cycle, which is a fundamental requirement for achieving proficiency in Earth and Space Sciences. By defining 12 distinct processes, the worksheet moves beyond simple models to include sophisticated concepts like sublimation and percolation. Research from Fisher & Frey (2014) emphasizes that front-loading technical vocabulary through visual aids allows students to engage more deeply with complex texts later in the unit. This infographic serves as that essential bridge, ensuring students have the linguistic and conceptual framework needed for higher-order analysis of Earth's systems. It is a high-utility tool for any standards-aligned science curriculum.