Line Graph Worksheets Printable for 4th Grade
These line graph worksheets printable for 4th grade give teachers a focused, sequenced set of resources that moves students from reading a scale accurately to explaining what the data shows over time — a progression that fits precisely where 4th graders are in their mathematical development. At this grade, students move past the basic "find the highest bar" tasks and begin working with intervals, trends, and the kind of comparative reasoning that requires more than eyeballing a chart.
The Specific Skills Each Worksheet Targets
Each worksheet in the set addresses a distinct part of what data analysis requires at this level. The tasks build outward from the mechanics of reading a graph to the reasoning that follows it.
- Scale reading: Students identify what each interval represents and practice reading values at and between labeled gridlines — the step where most 4th grade errors originate.
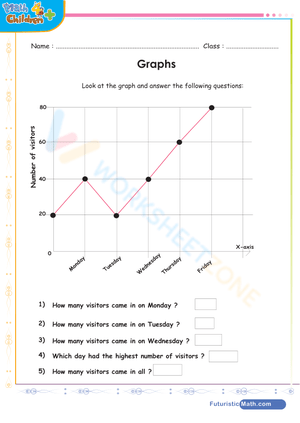
- Data point location: Students match a label on the horizontal axis — a day, week, or month — to its corresponding value on the vertical axis.
- Comparative reasoning: Students determine how much greater than or less than one value is compared to another, using the graph as evidence rather than estimation.
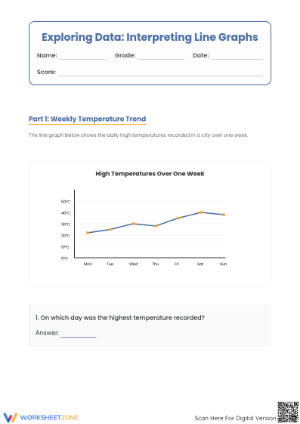
- Trend identification: Students describe where data increased, decreased, or held steady and connect that observation to the graph's subject matter.
- Interpretation questions: Students answer worded prompts that call for a conclusion, not just a number lifted from the graph.
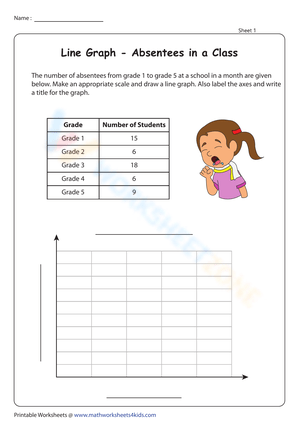
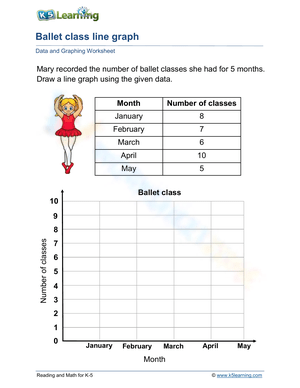
- Graph creation: Students work from a data table, select an appropriate scale, label both axes, plot points, and connect them in sequence.
When each of those tasks appears separately, teachers can see whether a student is struggling with the graph's structure or with the reasoning the graph is supposed to support. Those are different problems with different fixes.
Where These Worksheets Land in the Math Block
The most natural entry point is a whole-group lesson where a teacher projects one completed worksheet and reads it aloud — title first, then both axes, then the scale interval — before answering a single question. That sequence matters because 4th graders tend to scan for numbers immediately and skip the structural information that makes those numbers mean something. Modeling the reading routine explicitly is more effective than reminding students to "check the scale."
For math centers, a rotation of three worksheets at different task levels works well: one focused on locating and reading data points, one asking students to compare values and identify a trend, and one that provides a blank grid with a data table for graph creation. That setup keeps every group working on the same skill while the cognitive demand shifts by group. Line graph worksheets printable for 4th grade also serve as reliable homework when the layout is clear and the directions are self-contained — one graph with five or six focused questions is enough. For exit tickets, pull a comparison or trend question from a worksheet and ask students to show how they reached the answer. A glance at those responses tells you whether scale reading or interpretation needs more time the next day.
What Students Consistently Get Wrong on Line Graphs
The most frequent error is not forgetting to label an axis or connecting points out of order — it is misreading the scale. A student who reads a number line by ones will apply that same habit to a graph where the y-axis counts by fives or tens. The result is answers that are systematically off in a consistent direction: a student reads a data point sitting on the 30-line as 6 because there are six gridlines between zero and that point. The error does not look like carelessness; it looks like careful reading applied to the wrong counting unit.
A practical classroom move is to have students mark the scale labels with a pencil before answering anything. The 20 seconds that takes makes the interval explicit rather than assumed. Two other patterns show up regularly in student work. First, students confuse the highest data point with the greatest single-interval increase — they correctly identify the peak value but describe it as the "biggest jump" when the steepest rise actually happened two intervals earlier. Second, students misattribute values by reading the correct y-axis number but pairing it with the wrong x-axis label, usually because they lose their place when data points are close together. Both errors become visible quickly when teachers examine wrong answers rather than simply marking them.
Adjusting These Worksheets for a Range of Learners
To reduce the demand for students who are still building confidence with graph structure, use worksheets with labeled data points, scales that count by ones or twos, and direct questions like "How many books did Leon read in March?" Students who need additional language support benefit from sentence frames for comparison responses: "The value on ___ was greater than / less than the value on ___ by ___." That structure guides the response format without removing the data-reading task itself.
For students ready to go further, the most productive challenge is graph creation with a decision-making layer — give them a data table and ask them to choose a scale that fits the range of values before they start plotting. That single added requirement, choosing rather than following a preset scale, introduces genuine mathematical judgment. Multi-step questions that combine a trend observation with a numerical comparison also extend the work without requiring an entirely different resource. Line graph worksheets printable for 4th grade that include blank grid space make both kinds of extension straightforward to add alongside the standard reading and interpretation tasks.
Frequently Asked Questions
What should 4th graders be able to do with a line graph?
By the end of 4th grade, students should read titles, axes, and scales accurately; identify and compare specific data points; describe trends in plain language; and build a basic line graph from a data table with correct labels and a consistent scale. Those are the benchmarks these worksheets address.
How do I introduce line graphs to a class with limited prior exposure?
Start with a completed graph before students read one independently. Walk through the title, both axes, and the scale interval together as a class. Have students answer one direct question, then one comparison question, before moving to trend identification or creation tasks. Keeping those stages separate in early lessons prevents students from feeling uncertain about which skill they are supposed to be applying.
What is the difference between a line graph and a line plot at this grade level?
A line plot records individual data values as marks above a number line and shows how data is distributed across a range. A line graph connects data points to show how a measured value changes over time. Both appear in 4th grade, but they serve distinct purposes, and making that distinction explicit early prevents students from conflating the two formats when they encounter them on an assessment.
How should I spread these worksheets across a unit rather than using them all at once?
Most teachers find that line graph worksheets printable for 4th grade land better when distributed across two to three weeks rather than concentrated into a single block. Using one or two worksheets for initial instruction, several more during center and partner practice, and one as a final assessment check gives the skill enough spaced repetition to settle before students move on.
Clear All