


0
Views
0
Downloads
0.0
0
Save
0 Likes
What Do We Know About Pets?
0 Views
0 Downloads
Paste this activity's link or code into your existing LMS (Google Classroom, Canvas, Teams, Schoology, Moodle, etc.).
Students can open and work on the activity right away, with no student login required.
You'll still be able to track student progress and results from your teacher account.
Information
Description
What It Is:
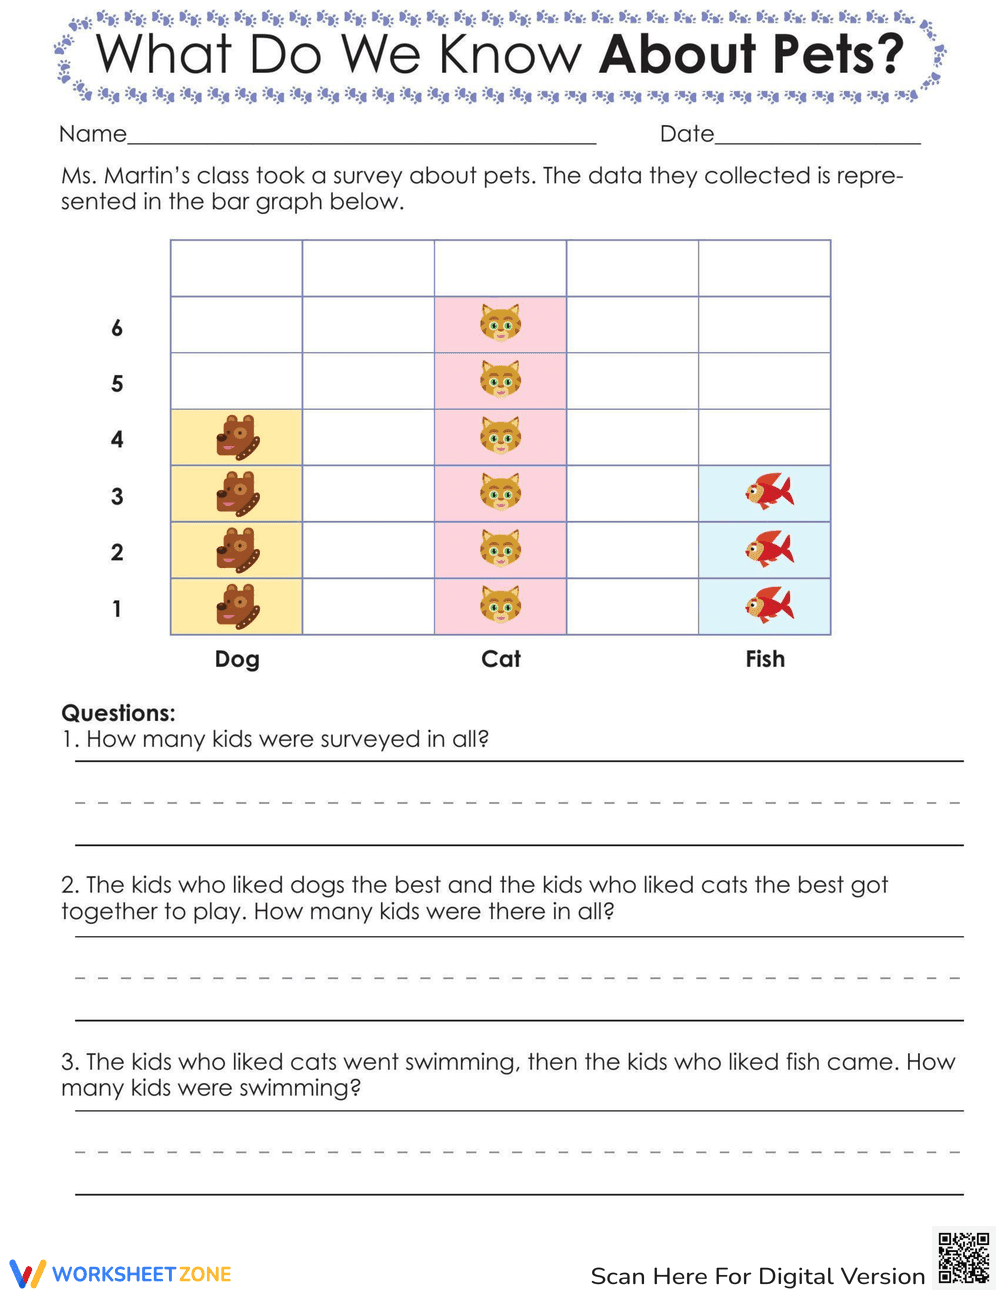
This is an educational worksheet titled 'What Do We Know About Pets?'. It features a bar graph visually representing survey data about students' favorite pets: dogs, cats, and fish. The graph shows that 4 students chose dogs, 5 chose cats, and 3 chose fish. Below the graph are three word problems that require students to interpret the data and perform simple addition.
Grade Level Suitability:
This worksheet is suitable for 1st and 2nd grade. The bar graph is simple to read, and the math problems involve basic addition, making it appropriate for students learning to interpret data and solve simple word problems.
Why Use It:
This worksheet helps students develop data interpretation skills, practice reading bar graphs, and improve their problem-solving abilities using simple addition. It reinforces the connection between visual data and numerical information.
How to Use It:
First, have students examine the bar graph and identify the number of students who chose each pet. Then, guide them to answer the word problems by using the information from the graph to perform the necessary addition. Encourage students to show their work.
Target Users:
This worksheet is ideal for elementary school students in the 1st and 2nd grade, especially those learning about data representation, bar graphs, and basic addition. It's also useful for teachers looking for engaging activities to reinforce these concepts.