


Views
Downloads
2.MD.D.10 Worksheet: Essential Data Analysis — Grade 2
Paste this activity's link or code into your existing LMS (Google Classroom, Canvas, Teams, Schoology, Moodle, etc.).
Students can open and work on the activity right away, with no student login required.
You'll still be able to track student progress and results from your teacher account.
This Grade 2 math worksheet provides comprehensive practice in data analysis and graph interpretation. Students engage with three distinct data representations to solve real-world mathematical problems. By extracting information from tally charts, pictographs, and bar graphs, learners develop the critical thinking skills necessary to compare quantities and calculate totals within a structured data set.
At a Glance
- Grade: 2 · Subject: Math
- Standard:
CCSS.MATH.CONTENT.2.MD.D.10— Solve simple put-together, take-apart, and compare problems using information in graphs- Skill Focus: Interpreting Tally Charts, Pictographs, and Bar Graphs
- Format: 5 pages · 16 problems · Answer key included · PDF
- Best For: End-of-unit assessment or intensive skill practice
- Time: 30–45 minutes
What's Inside
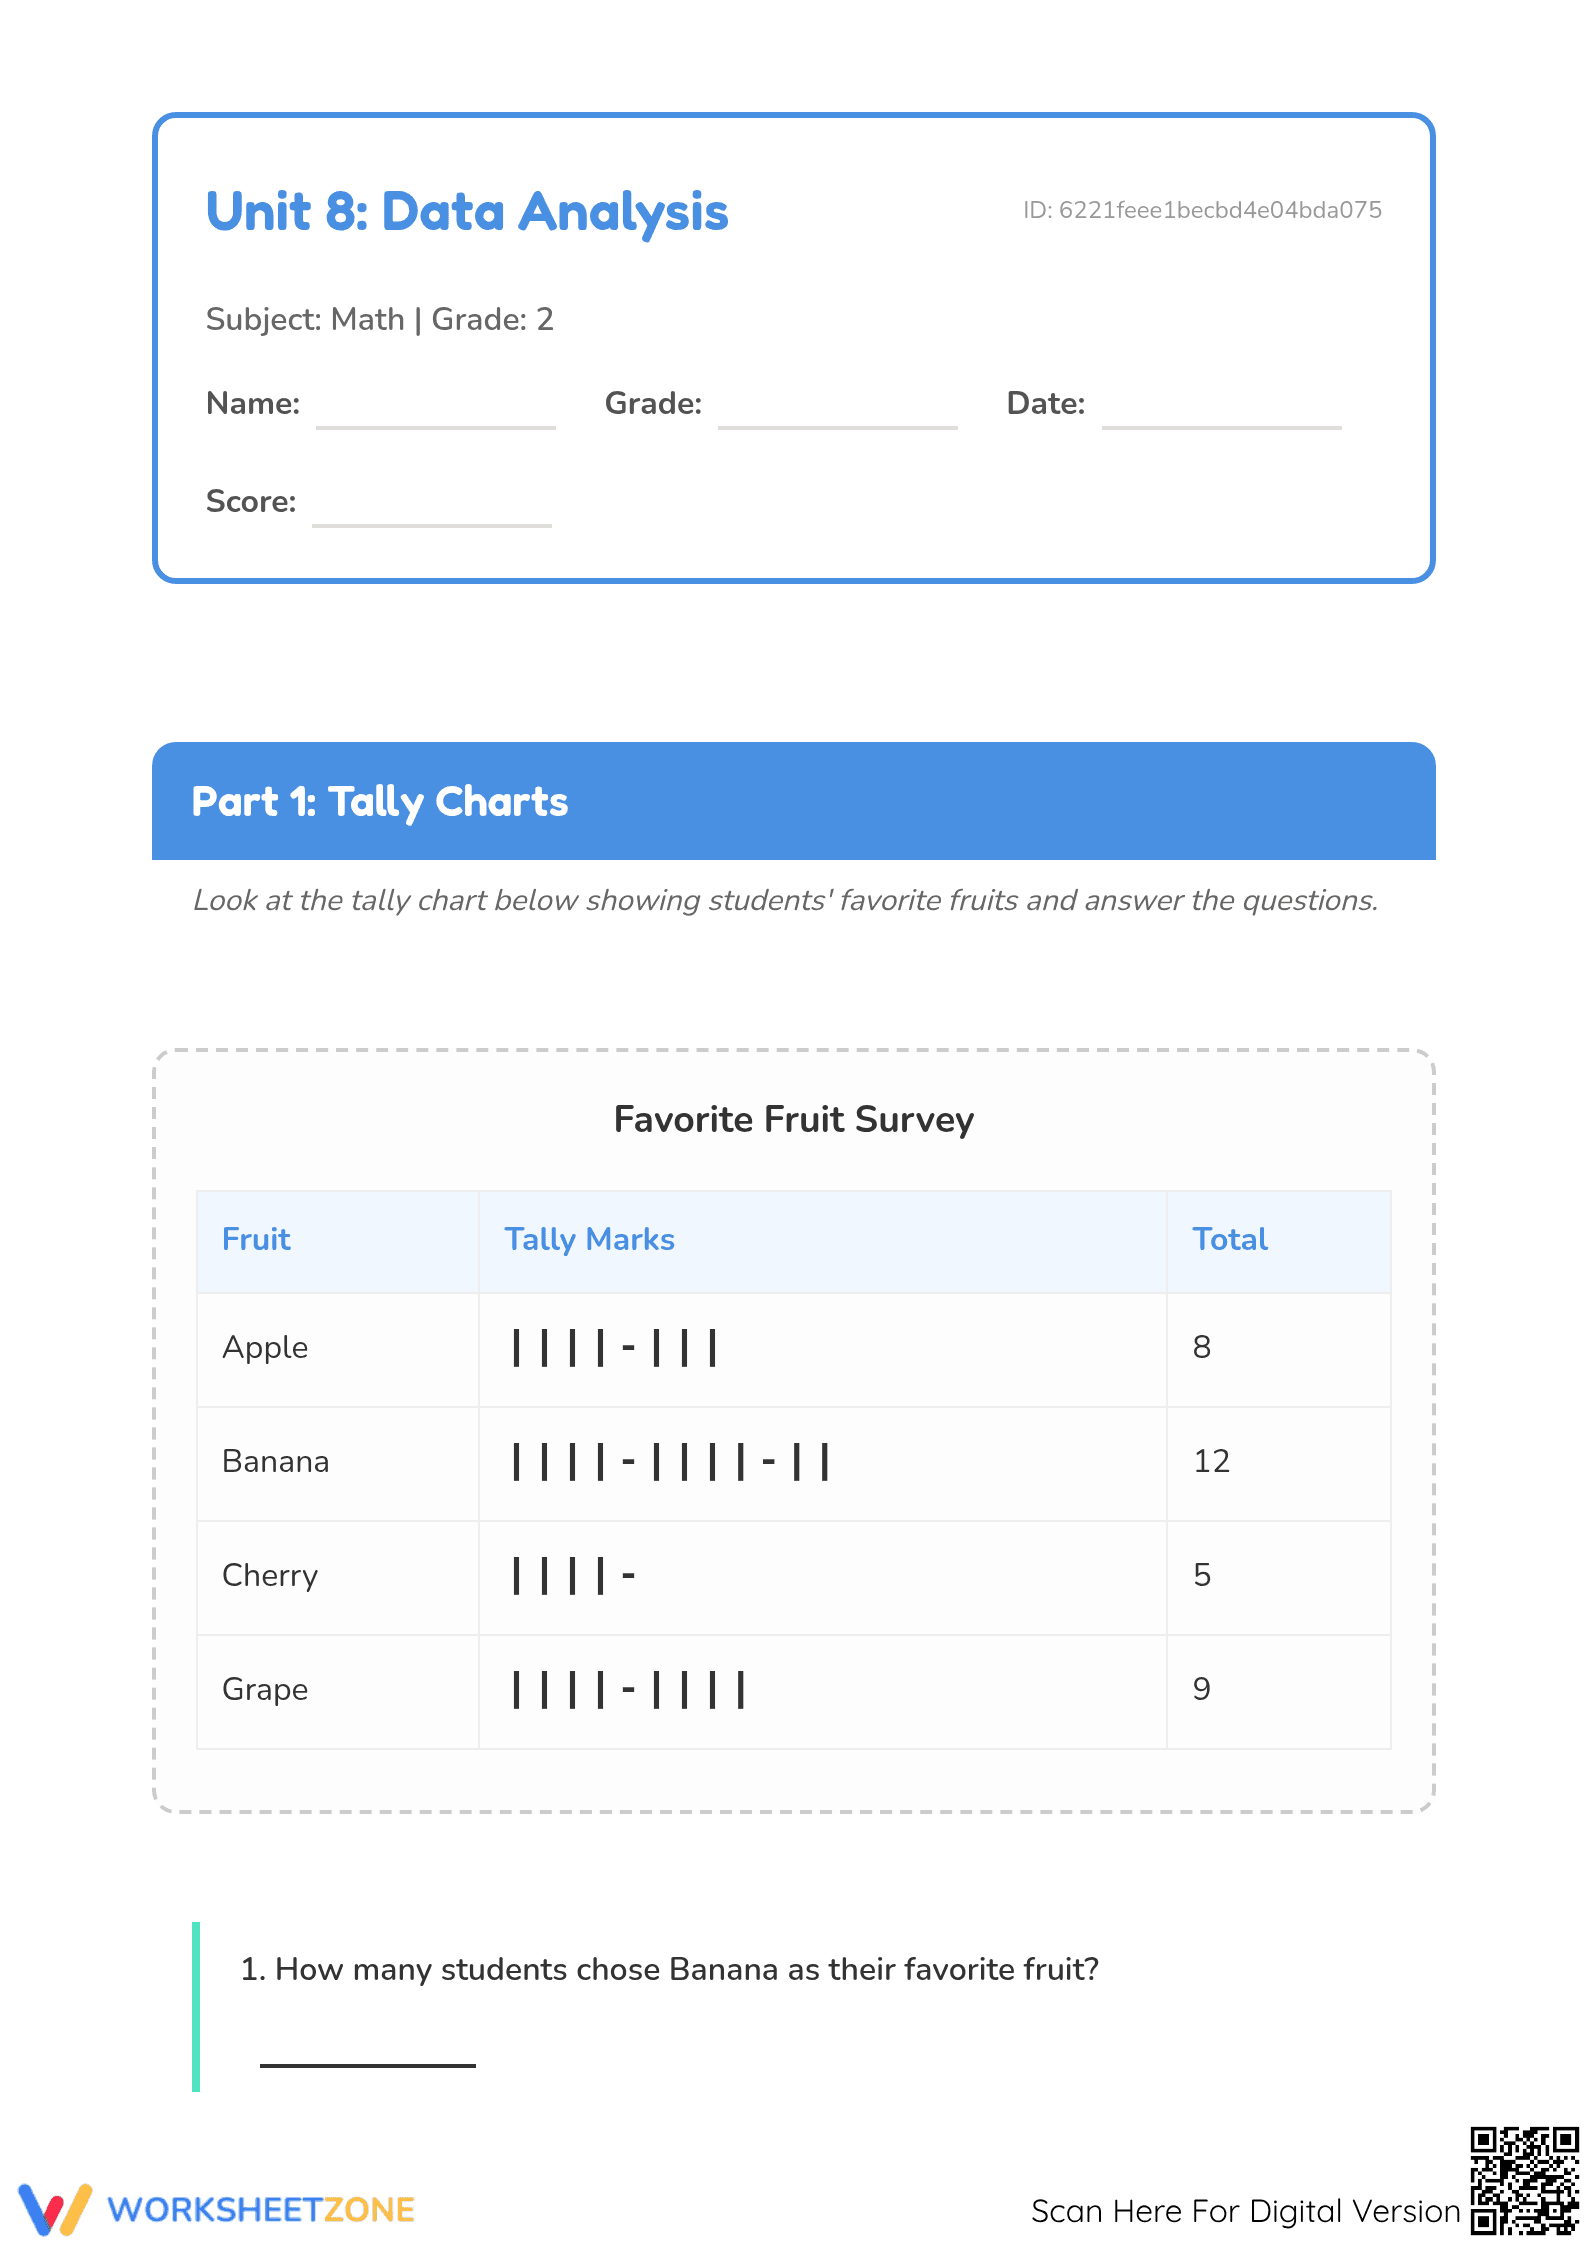
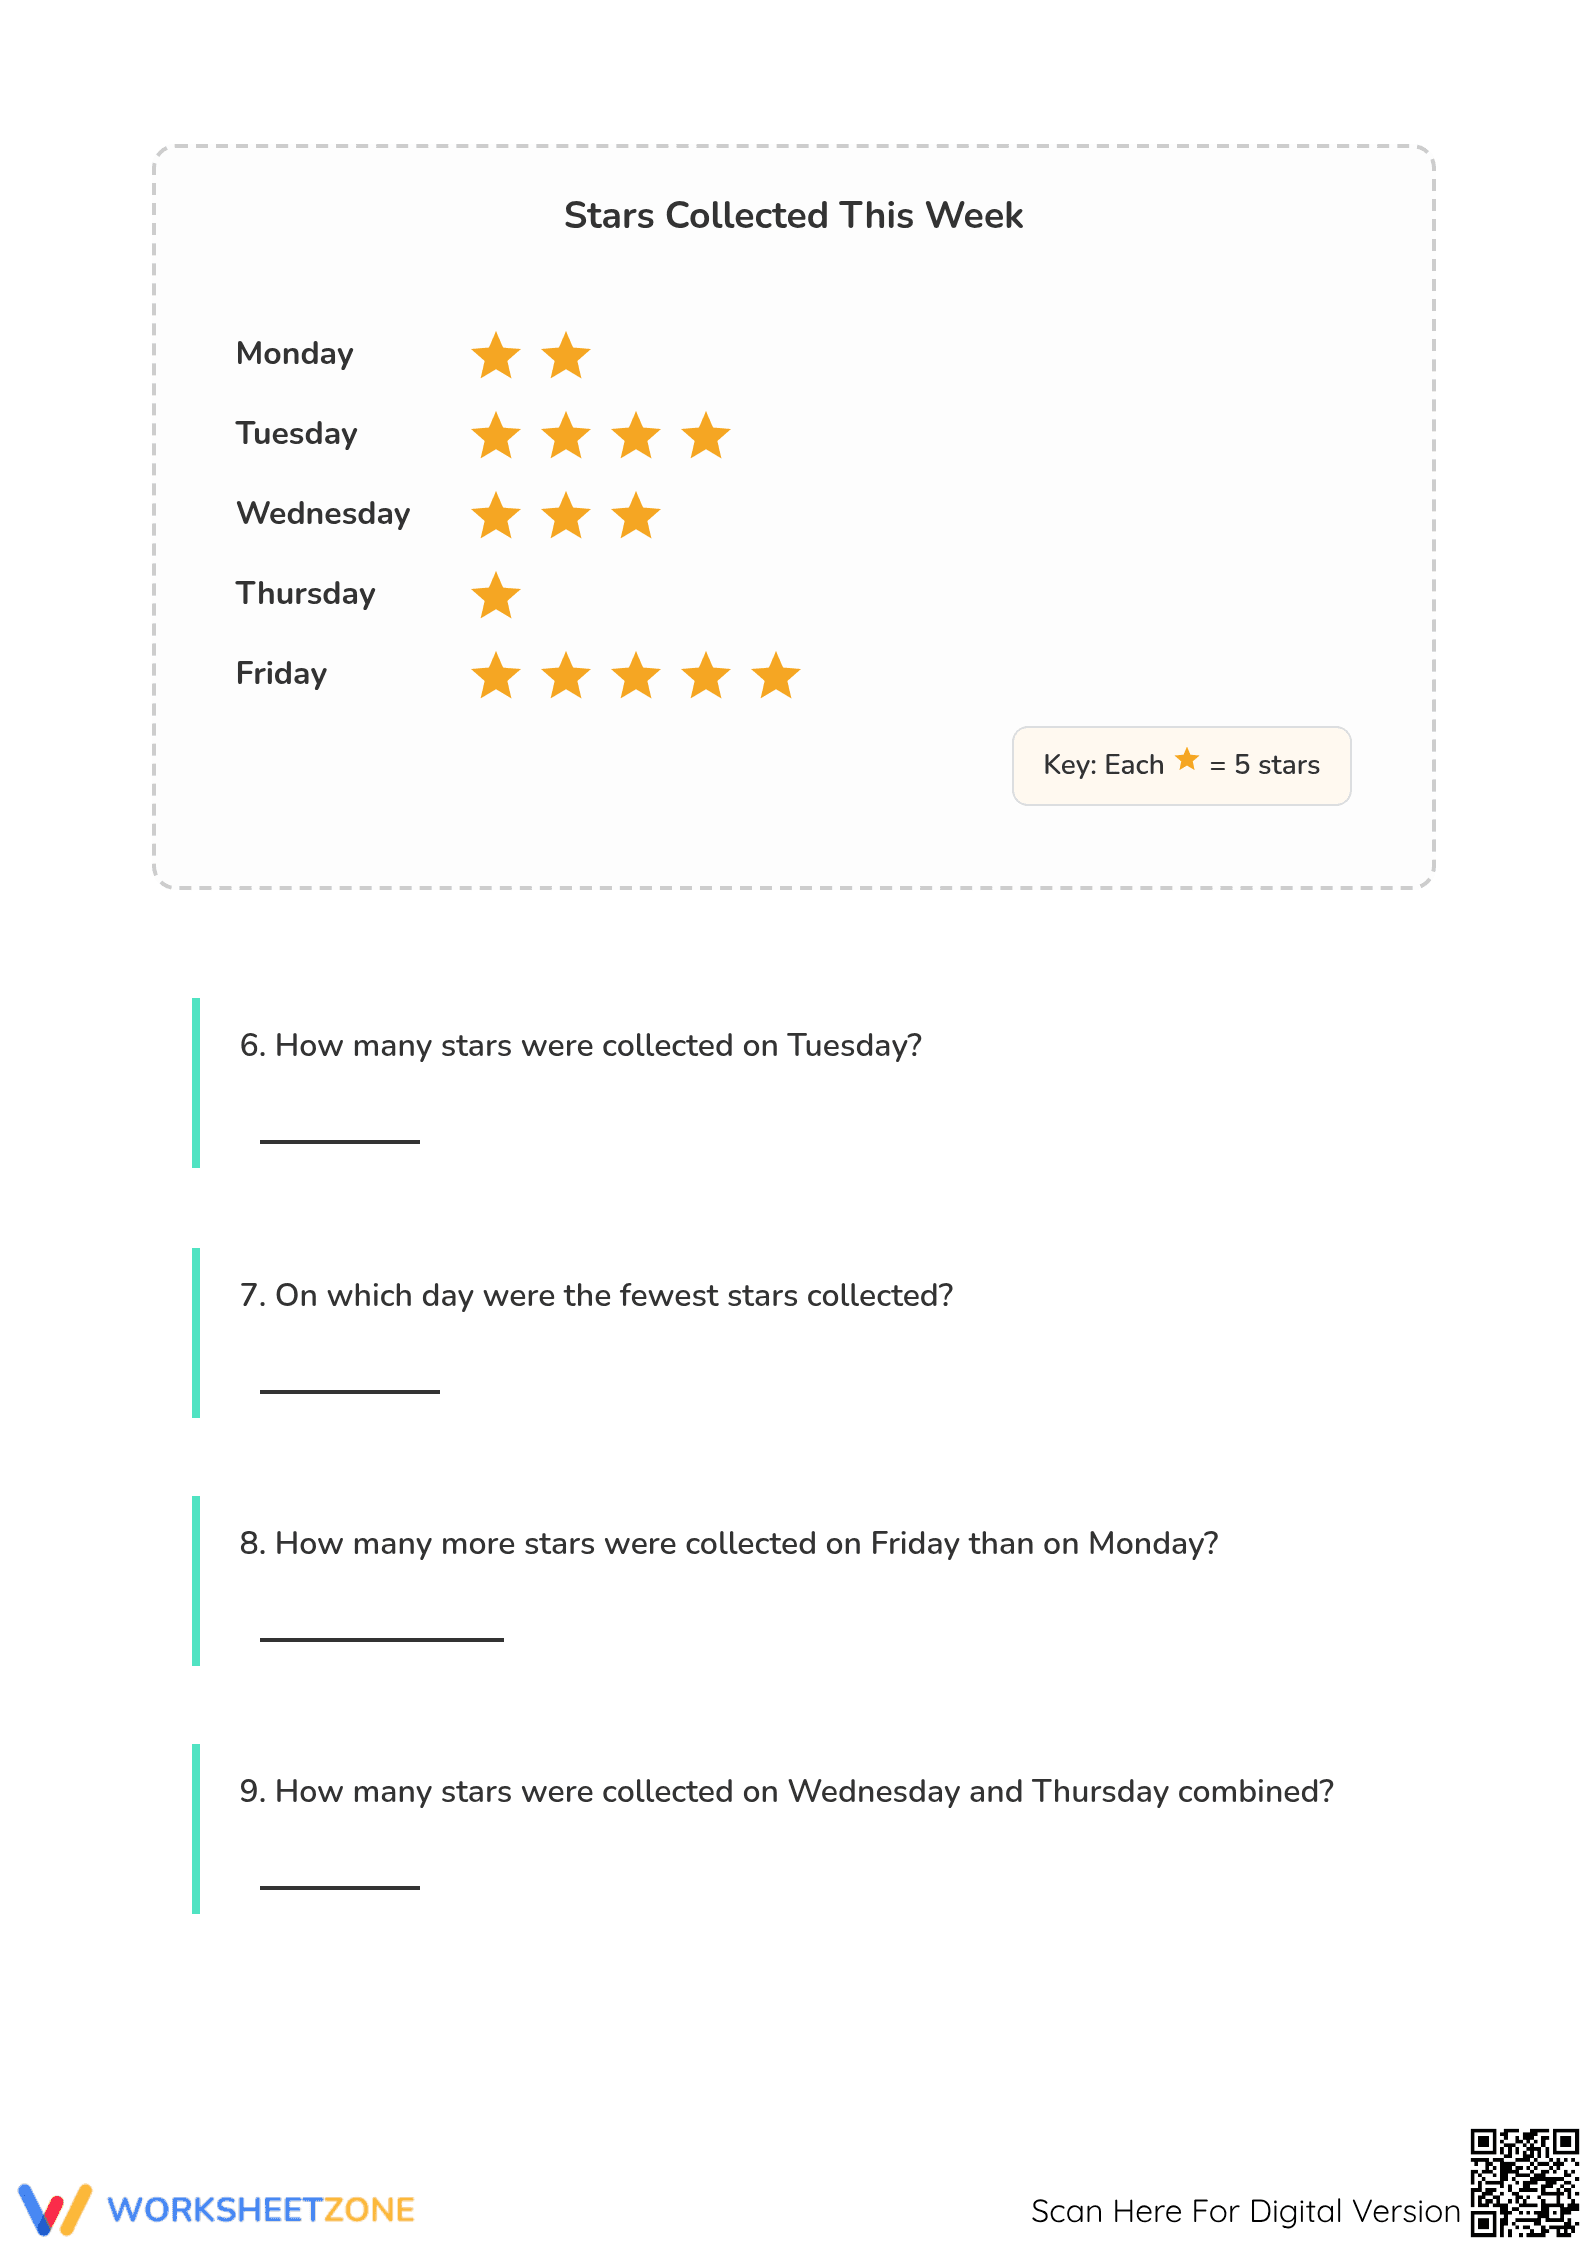
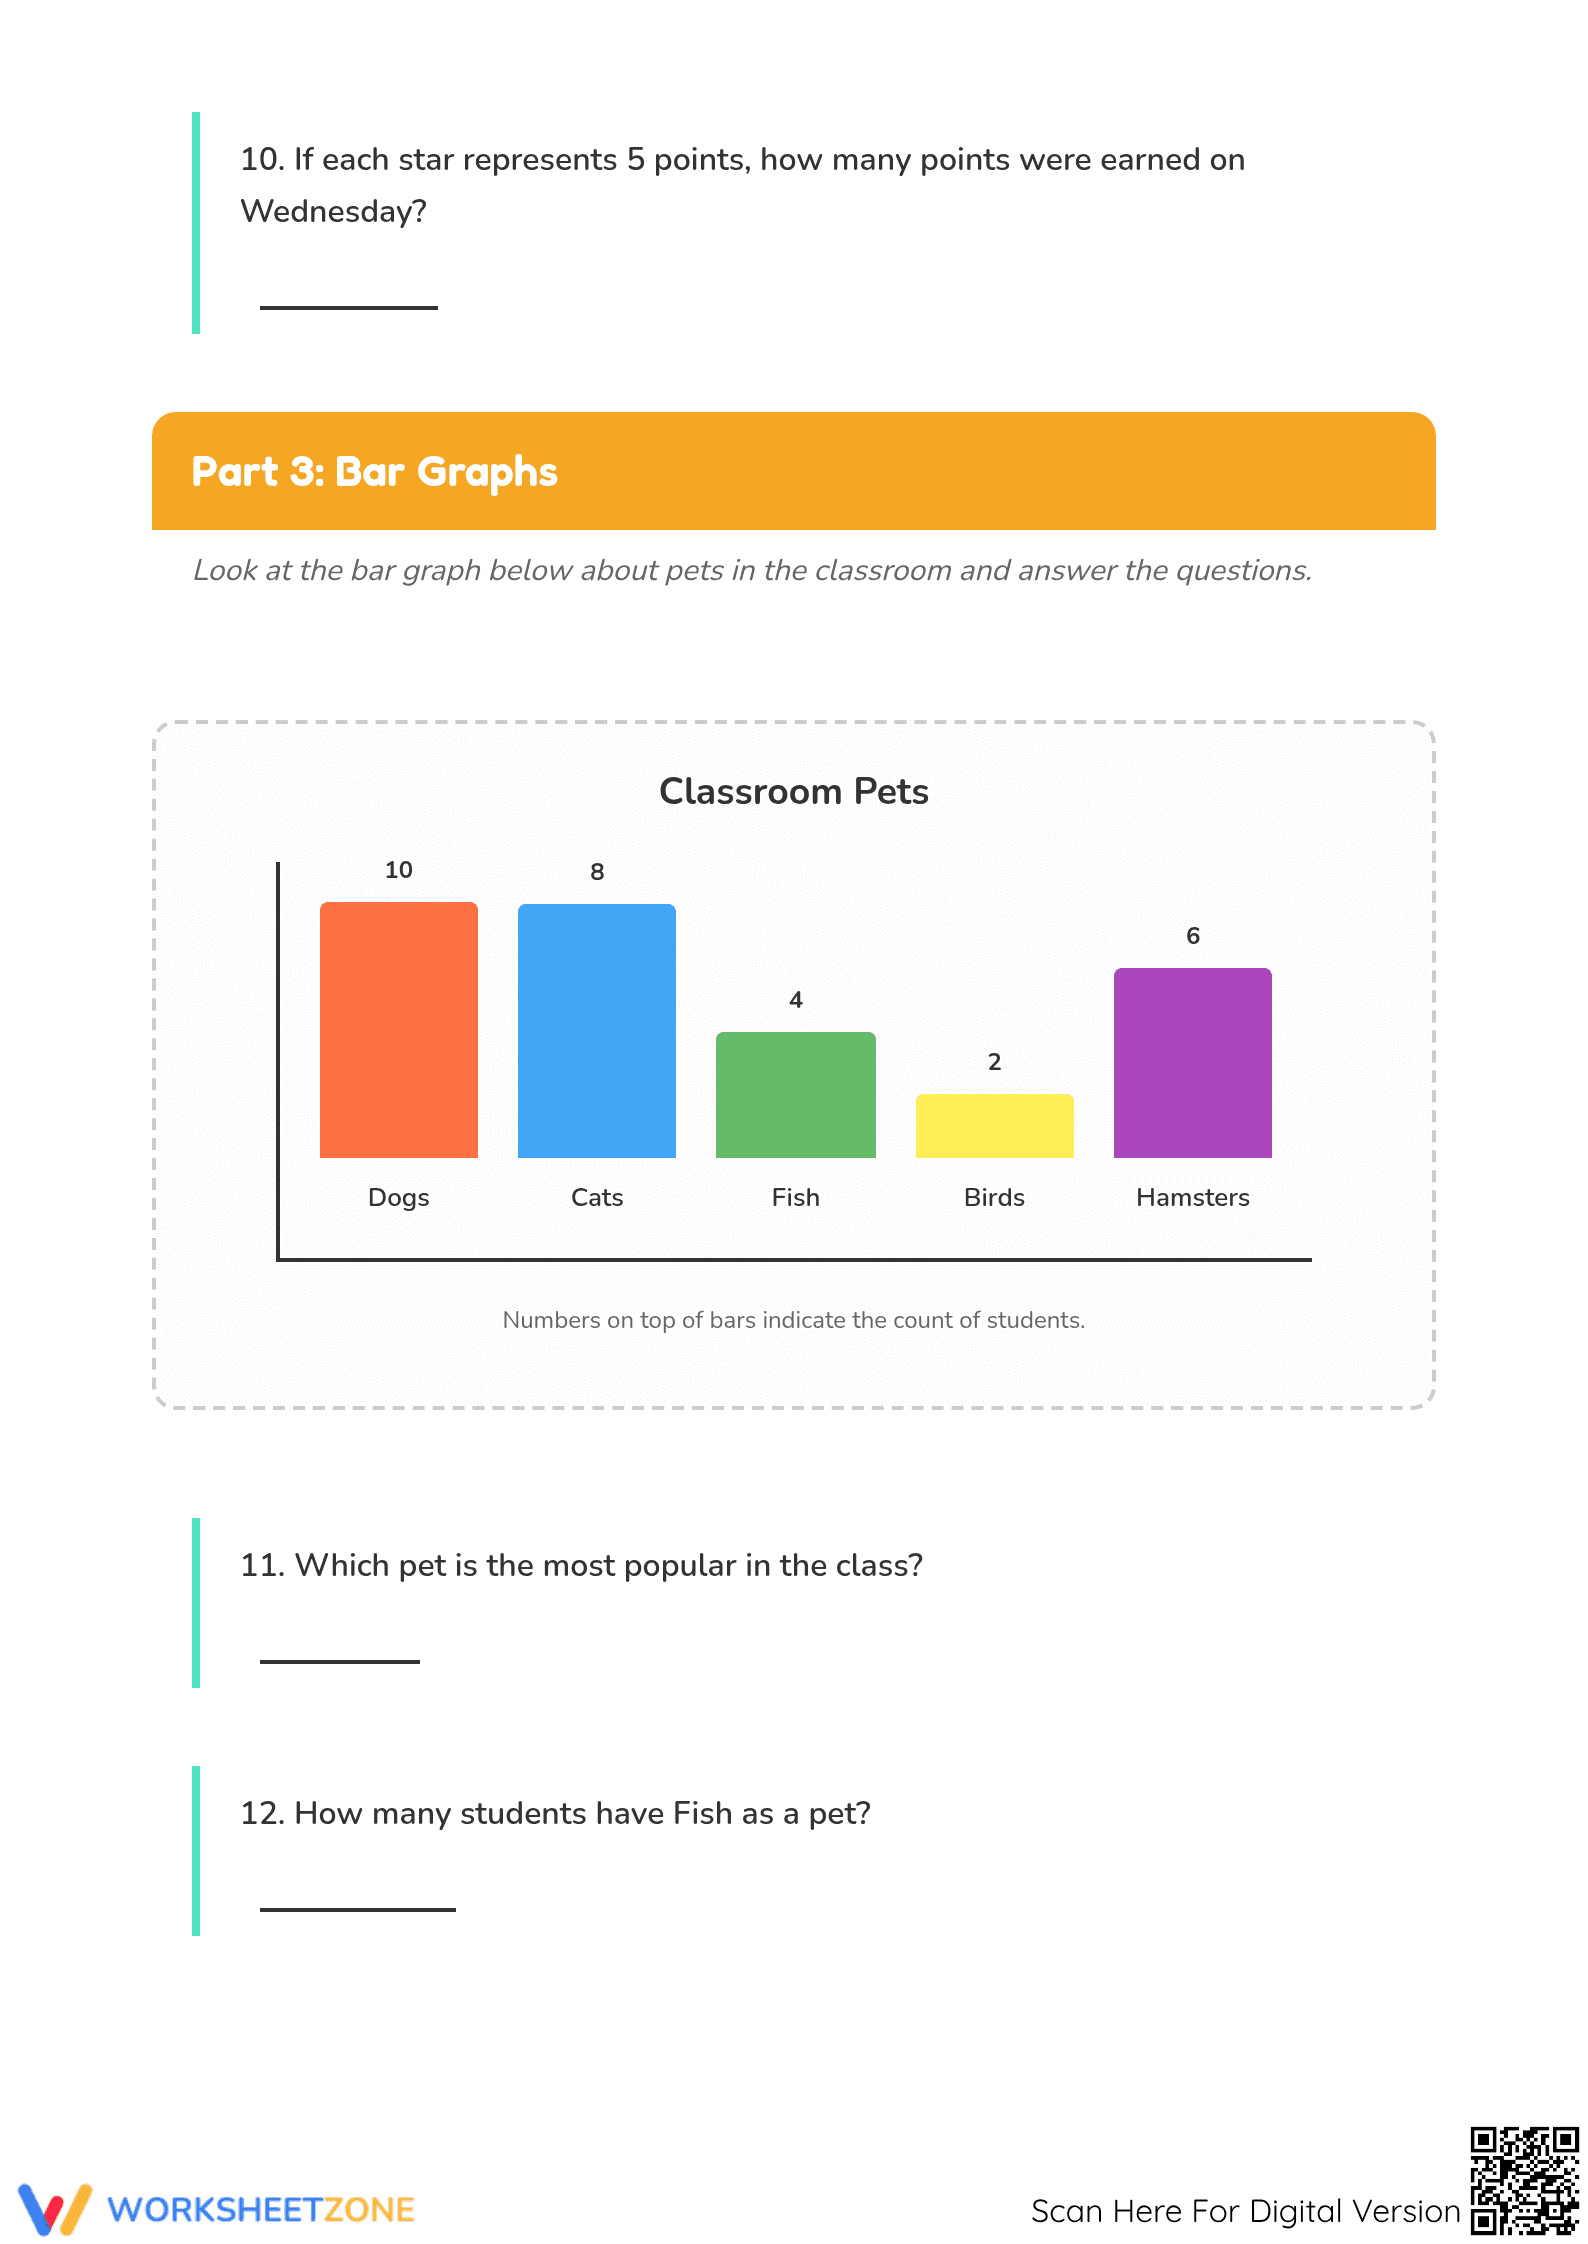
This 5-page resource has three parts. Part 1 features a tally chart with 5 questions. Part 2 introduces a pictograph with a key where one symbol equals 5 units. Part 3 concludes with a bar graph about classroom pets. A full answer key is provided for all 16 tasks.
Mastery Evidence
The 16 tasks provide evidence of mastery for the CCSS.MATH.CONTENT.2.MD.D.10 standard. Questions range from direct retrieval (Approaching) to complex comparisons (Meeting). The final section demands multi-step reasoning (Exceeding), such as identifying category combinations. These tasks map directly to standard sub-skills, and scores can be entered directly into gradebooks or IEP progress notes to track student growth.
Standards Alignment
The primary focus is CCSS.MATH.CONTENT.2.MD.D.10, which requires students to draw and interpret picture and bar graphs with up to four categories. This worksheet specifically targets the interpretation and problem-solving aspect of the standard. Additionally, it supports `2.OA.A.1` as students use addition and subtraction within 100 to solve one- and two-step word problems based on the data. Both standard codes can be copied directly into lesson plans, IEP goals, or district curriculum mapping tools.
How to Use It
Use this as a summative assessment after a data unit. Alternatively, assign pages as formative checks. Observe if students correctly apply the pictograph key (1 star = 5 points). Expect completion within 30 to 45 minutes depending on reading levels.
Who It's For
This resource is for second-grade students but works for third-grade review. It is ideal for general education, small groups, or homework. Pair this with a classroom anchor chart for maximum instructional impact.
According to the RAND AIRS 2024 report, structured exposure to multiple data representations in early elementary grades is a significant predictor of later success in algebraic reasoning and statistical literacy. This worksheet directly addresses the CCSS.MATH.CONTENT.2.MD.D.10 standard by requiring students to perform 'put-together, take-apart, and compare' operations on data sets. Research from Fisher & Frey (2014) emphasizes that interpreting visual data requires a specific set of literacy skills that must be explicitly practiced through varied formats like tally charts and pictographs. By engaging with 16 targeted problems, students move beyond simple identification to higher-order analysis. This resource provides the necessary repetition and variety to ensure that Grade 2 learners can fluently translate visual information into numerical solutions. The inclusion of a scaled pictograph key further aligns with rigorous expectations for mathematical precision and attention to detail in data interpretation. This comprehensive approach ensures students meet foundational data analysis benchmarks effectively.