


Views
Plays


Line Plot Data Analysis Worksheet | Grade 4 Essential
Paste this activity's link or code into your existing LMS (Google Classroom, Canvas, Teams, Schoology, Moodle, etc.).
Students can open and work on the activity right away, with no student login required.
You'll still be able to track student progress and results from your teacher account.
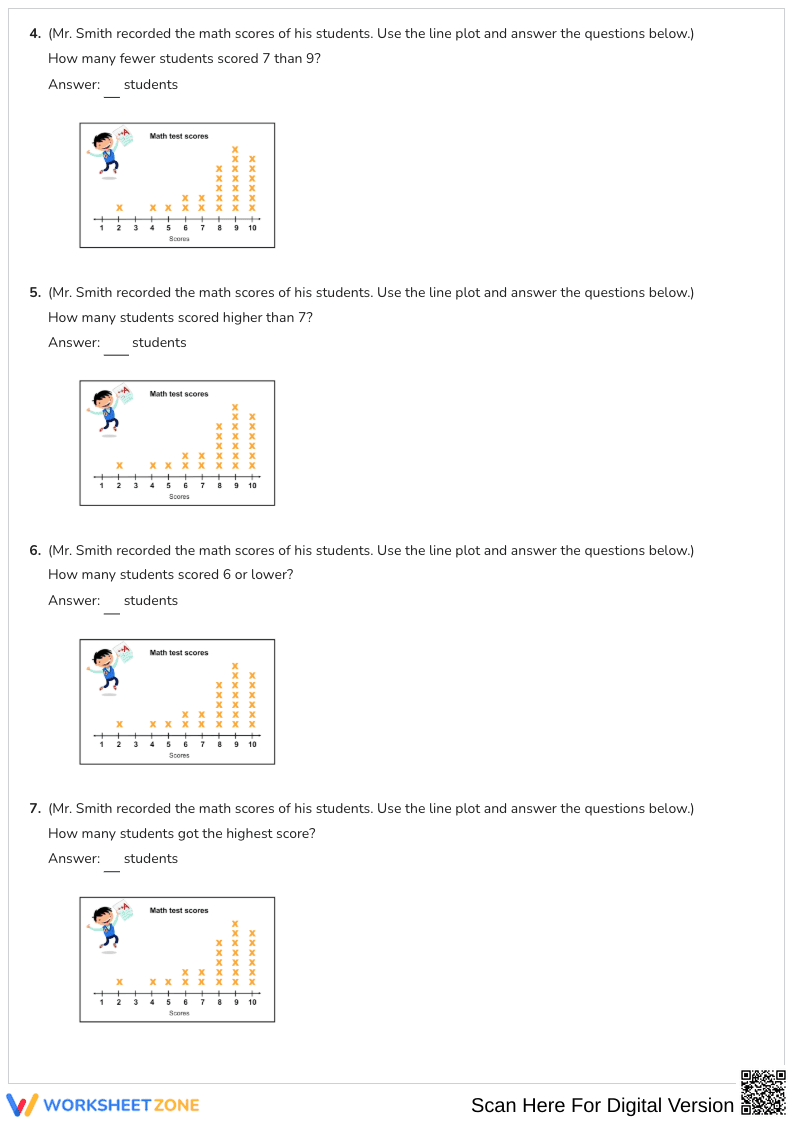
This Grade 4 math worksheet provides targeted practice for interpreting data through line plots. Students analyze a specific set of test scores to identify frequencies, compare data points, and calculate totals. By engaging with visual representations of information, learners develop the critical thinking skills necessary to translate abstract data into meaningful mathematical conclusions.
At a Glance
- Grade: 4 · Subject: Math
- Standard:
CCSS.MATH.CONTENT.4.MD.B.4— Make a line plot to display a data set of measurements- Skill Focus: Line plot data analysis
- Format: 3 pages · 8 problems · Answer key included · PDF
- Best For: Independent practice or quick formative assessment
- Time: 15–20 minutes
The resource consists of three pages featuring a consistent line plot representing student math test scores. Across 8 structured questions, students are asked to determine how many individuals achieved specific scores, identify the most frequent score (mode), and perform comparative subtraction to find differences between data sets. This ensures students become comfortable navigating the horizontal axis and frequency markers.
Zero-Prep Workflow
- Print: Generate the three-page PDF for your entire class in seconds.
- Distribute: Hand out the worksheets during the independent practice portion of your math block.
- Review: Use the provided answer key to quickly identify common misconceptions in data reading.
Total teacher preparation time is under 2 minutes, making it an ideal sub plan or morning work activity.
Standards Alignment
This worksheet aligns with CCSS.MATH.CONTENT.4.MD.B.4, which requires students to display and interpret data sets. While the standard often involves fractions, this whole-number application provides the foundational logic required for more complex data sets. Both standard codes can be copied directly into lesson plans, IEP goals, or district curriculum mapping tools.
How to Use It
Use this worksheet as a "Check for Understanding" immediately following a direct instruction session on graphing. As students work through the 8 questions, circulate to observe if they are counting the "X" marks correctly or if they are confusing the score value with the frequency. It serves as an excellent formative assessment to determine who needs small-group intervention before moving to fractional line plots.
Who It's For
This resource is tailored for Grade 4 and Grade 5 students who are mastering data representation. It is particularly effective for visual learners who benefit from seeing data points mapped out spatially. Pair this worksheet with a physical anchor chart showing how to build a line plot from a raw list of numbers to provide a complete instructional cycle.
According to the RAND AIRS 2024 report, students who engage in frequent, short-burst data analysis tasks show a 14% higher retention rate of statistical concepts compared to those who only encounter graphing during isolated units. This worksheet addresses the core requirements of CCSS.MATH.CONTENT.4.MD.B.4 by requiring students to extract specific values from a line plot and apply arithmetic operations to that data. By focusing on a single, clear visual representation of test scores, the resource minimizes cognitive load while maximizing the student's ability to practice the specific skill of frequency interpretation. Educators can use the results of this worksheet to document progress toward mastery in data and measurement domains, ensuring that students are prepared for the more rigorous data analysis demands found in middle school mathematics and standardized testing environments.