


Views
Downloads


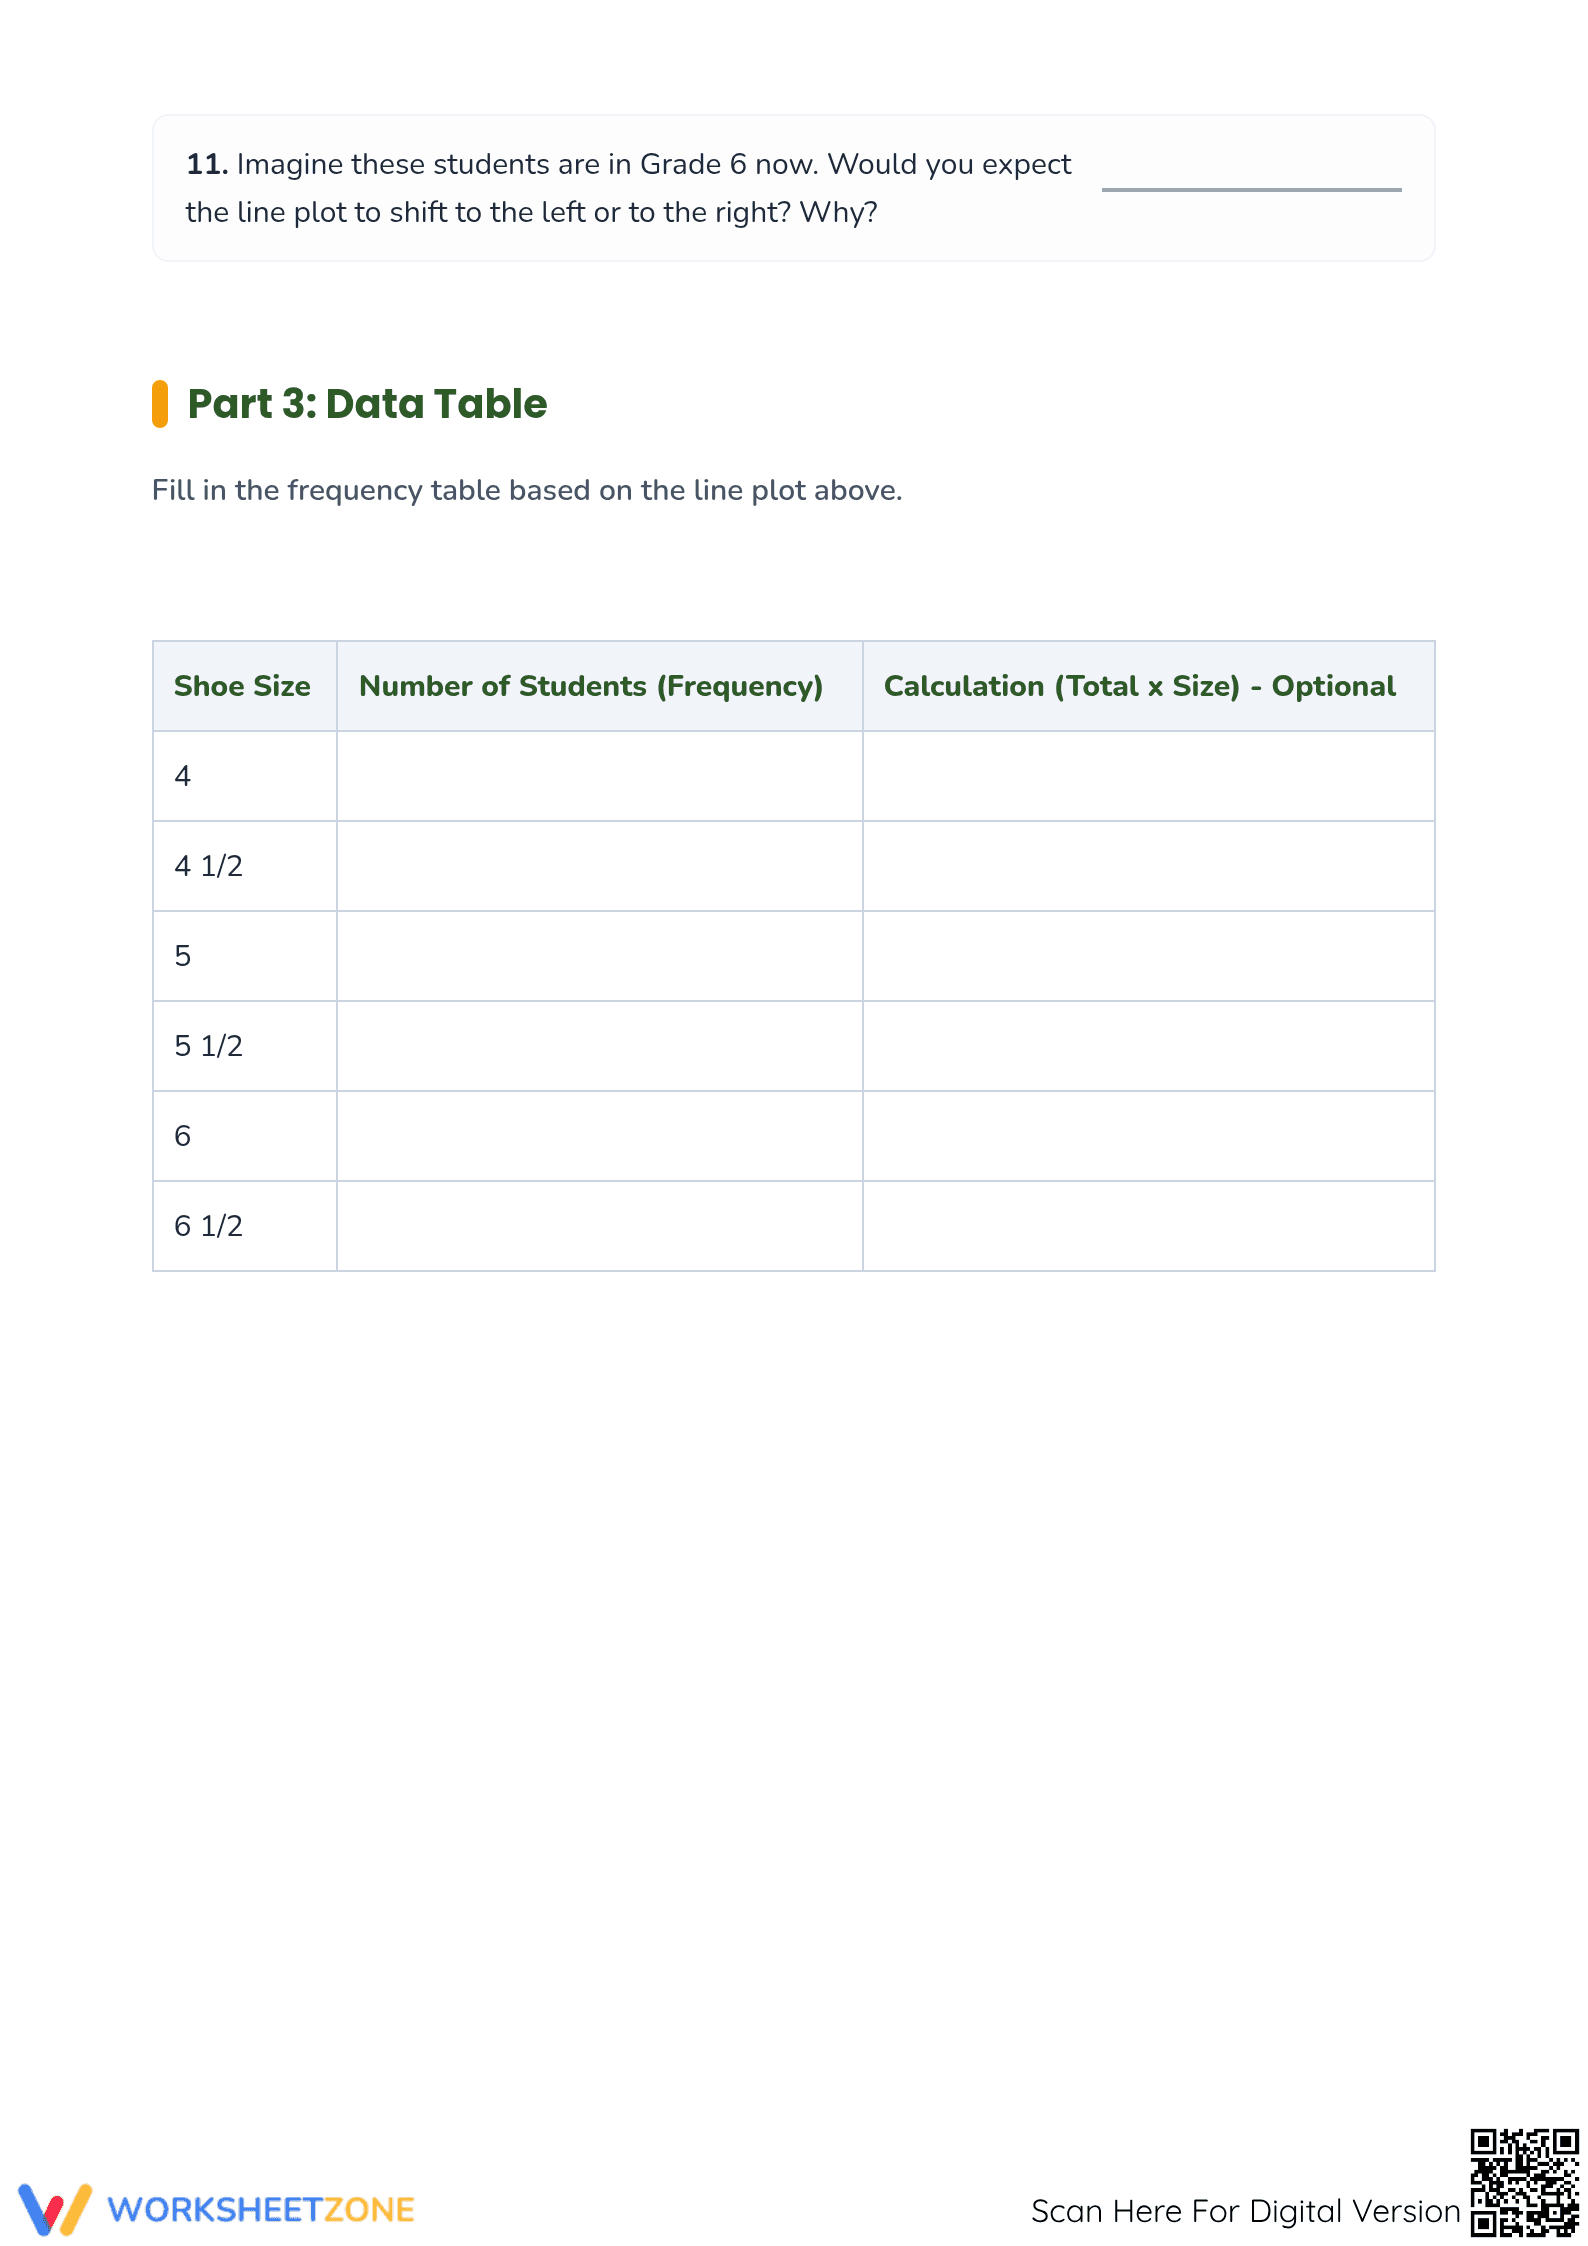
Essential Shoe Sizes Line Plot Worksheet | Grade 4-5
Paste this activity's link or code into your existing LMS (Google Classroom, Canvas, Teams, Schoology, Moodle, etc.).
Students can open and work on the activity right away, with no student login required.
You'll still be able to track student progress and results from your teacher account.
This Grade 4 math worksheet focuses on interpreting and analyzing line plots using fractional data. Students move beyond simple counting to engage in comparative analysis and frequency mapping. By translating visual data into a structured table, learners develop the essential graphing skills required for upper elementary mathematics and real-world data literacy.
At a Glance
- Grade: 4 · Subject: Math
- Standard:
CCSS.MATH.CONTENT.4.MD.B.4— Make a line plot to display a data set of measurements in fractions of a unit- Skill Focus: Line plot interpretation and frequency table construction
- Format: 3 pages · 12 tasks · Answer key included · PDF
- Best For: Independent practice or small group instruction
- Time: 25–35 minutes
The resource contains three distinct sections designed to build cognitive depth. Page one introduces the "Shoe Sizes of Grade 3 Students" line plot with basic retrieval questions. Page two challenges students with "Deeper Analysis," requiring range calculations and group comparisons. The final page features a predictive thinking task and a frequency table for data organization, accompanied by a comprehensive answer key for efficient grading.
Print-and-go worksheet designed for immediate classroom integration. Teachers can print the three-page set in under 30 seconds. Distribution to students takes less than a minute, and the included answer key allows for a five-minute whole-class review. It is an ideal resource for emergency sub plans where teacher setup time is at a premium.
The primary focus is `CCSS.MATH.CONTENT.4.MD.B.4`, which requires students to solve problems involving addition and subtraction of fractions by using information presented in line plots. It also supports 5.MD.B.2 by introducing data redistribution concepts. Both standard codes can be copied directly into lesson plans, IEP goals, or district curriculum mapping tools.
Use this as a mid-unit formative assessment to gauge student comfort with fractional number lines. During the activity, observe if students accurately identify "frequency" versus "value" on the X-axis. It also functions well as an exit ticket after a direct instruction lesson on data distribution, providing clear evidence of mastery before moving to more complex probability concepts.
This packet is tailored for Grade 4 and 5 students who are transitioning from whole-number graphs to fractional data sets. It provides scaffolds for learners needing visual support while offering extension questions for high-achievers. It pairs naturally with a math journal entry or a physical classroom activity where students collect and plot their own data.
According to the NAEP 2022 Mathematics Framework, the ability to interpret data from diverse graphical representations is a critical milestone for 4th-grade achievement. This resource aligns with `CCSS.MATH.CONTENT.4.MD.B.4` by requiring students to extract, compare, and organize fractional measurements from a line plot. Research by Fisher & Frey (2014) emphasizes the importance of "checking for understanding" through varied task types. By integrating a frequency table with a visual plot, this worksheet facilitates the dual-coding of information, which is shown to improve long-term retention. The multi-step structure ensures that students engage with data multiple times, moving from surface-level retrieval to deeper statistical reasoning. This approach mirrors best practices identified in the RAND AIRS 2024 report, which highlights the necessity of structured practice in developing foundational data literacy skills for middle-school readiness and success.