


























Views
Downloads

Grade 5 Bar Graph Revision | Essential Math Worksheet
Paste this activity's link or code into your existing LMS (Google Classroom, Canvas, Teams, Schoology, Moodle, etc.).
Students can open and work on the activity right away, with no student login required.
You'll still be able to track student progress and results from your teacher account.
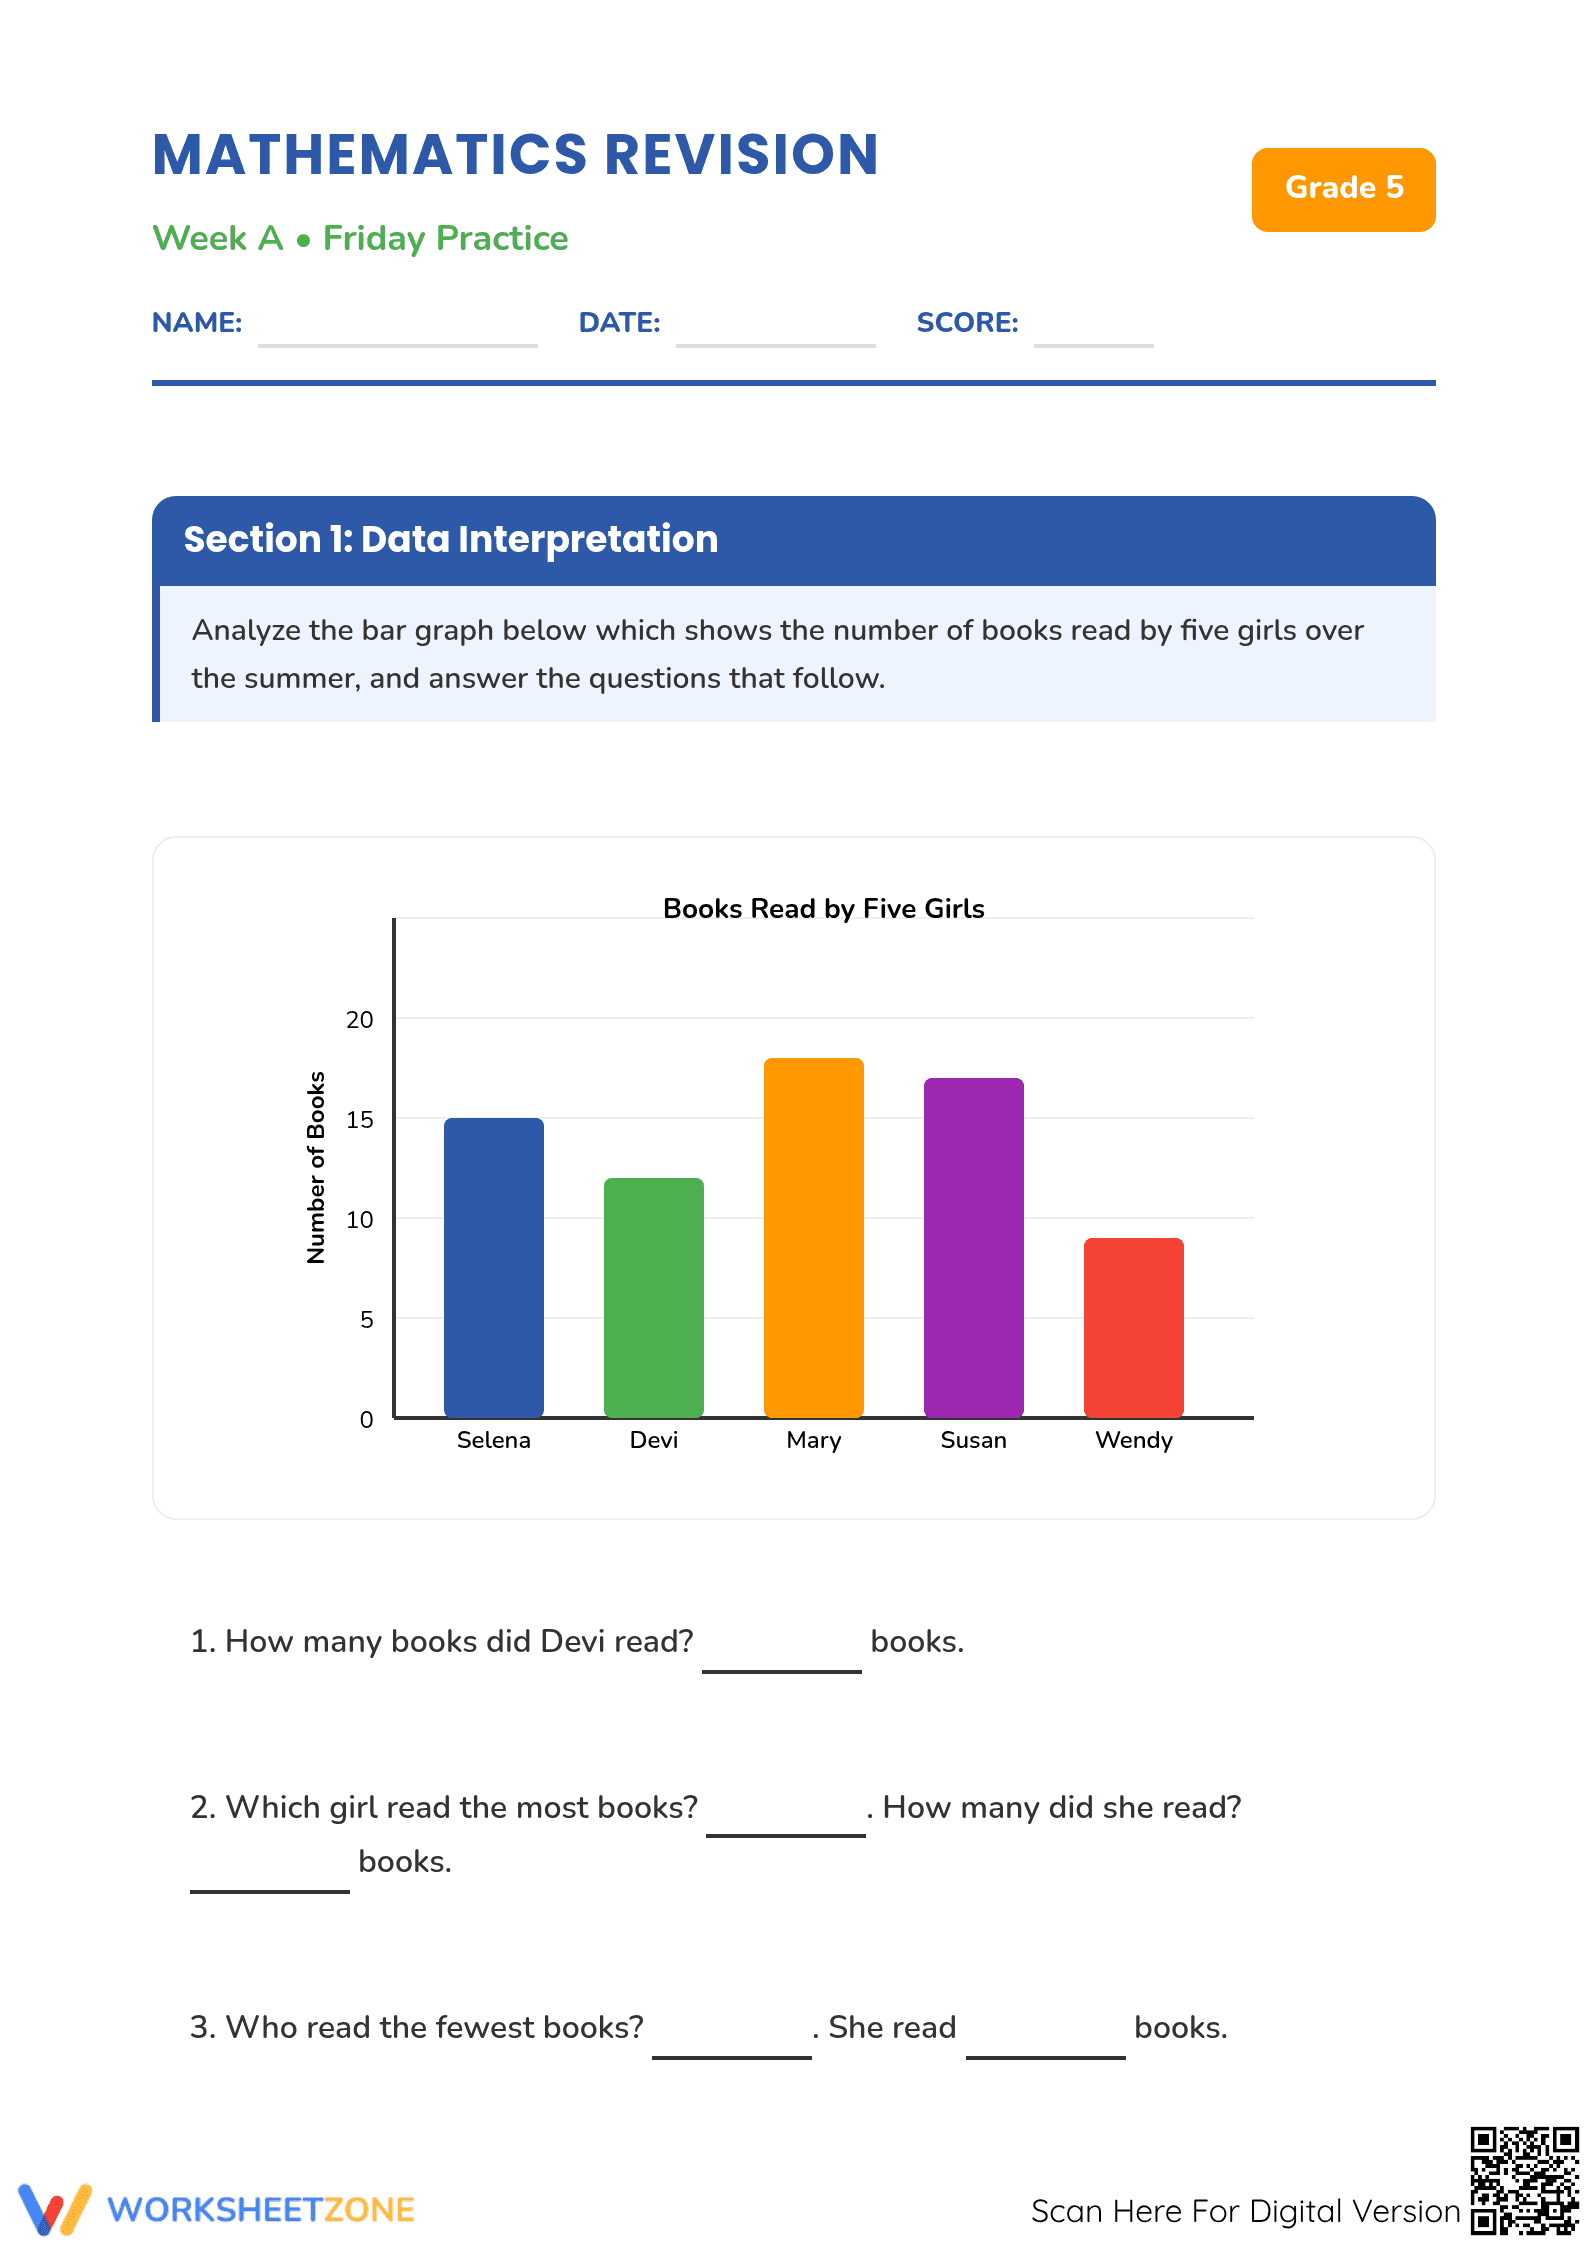
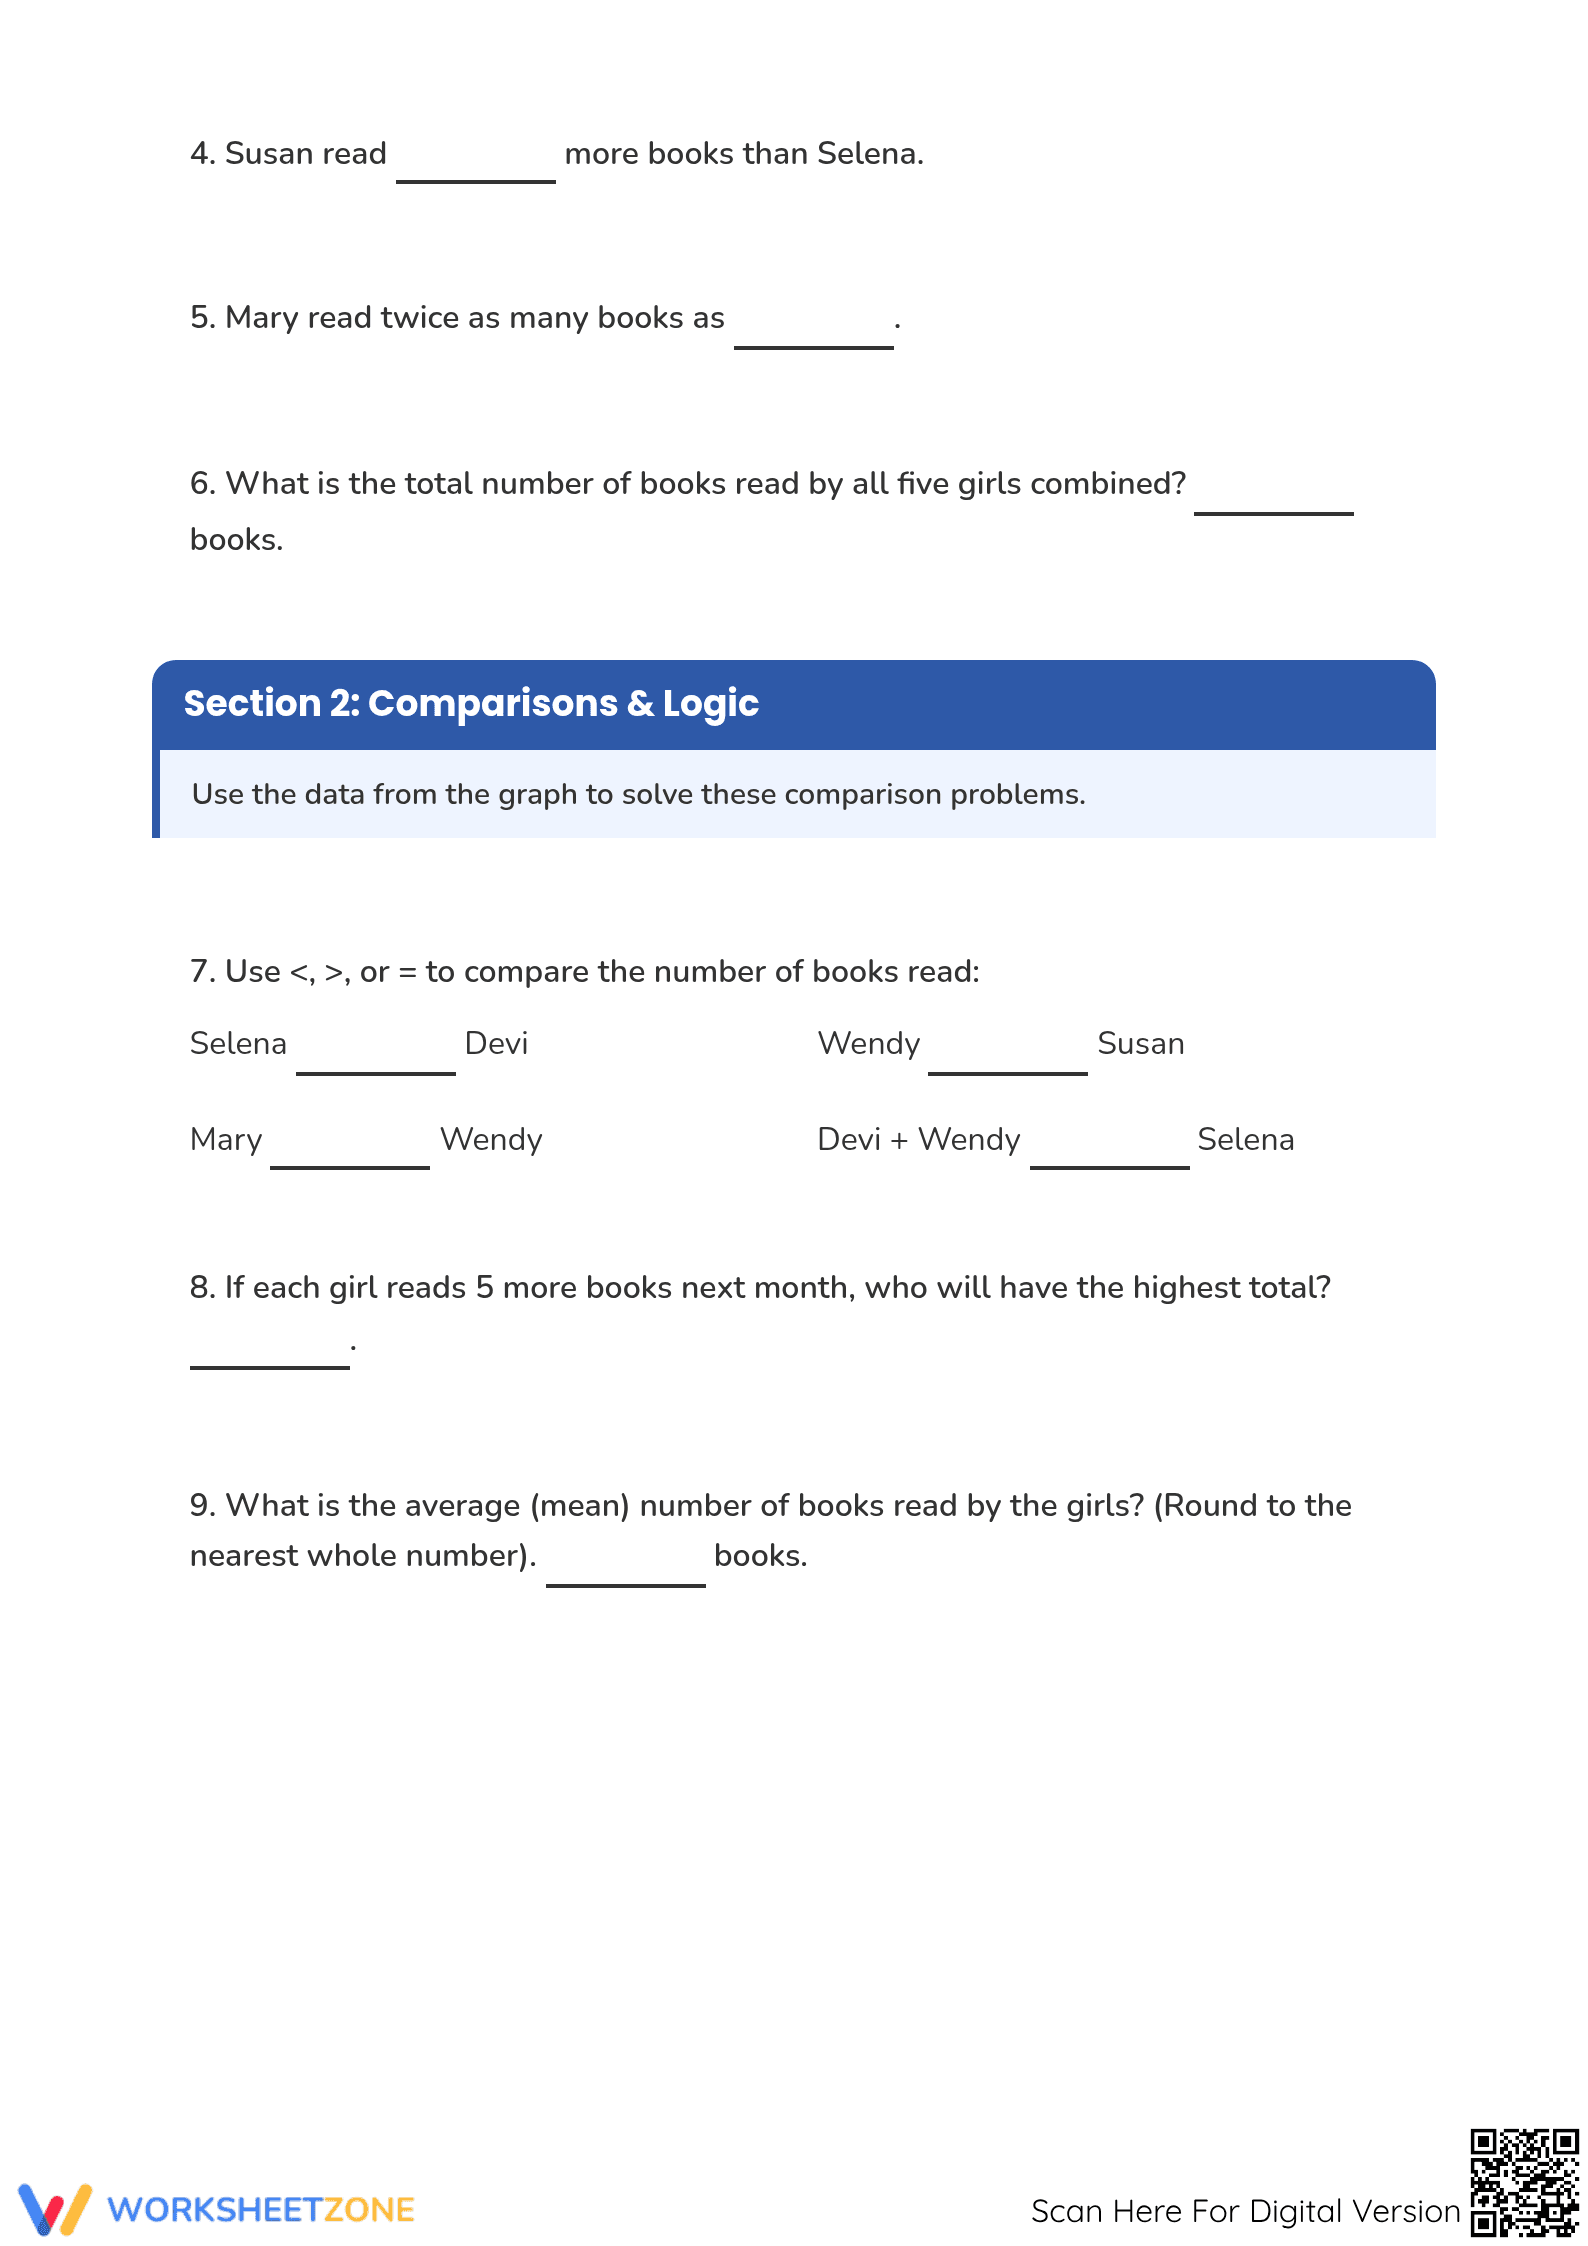
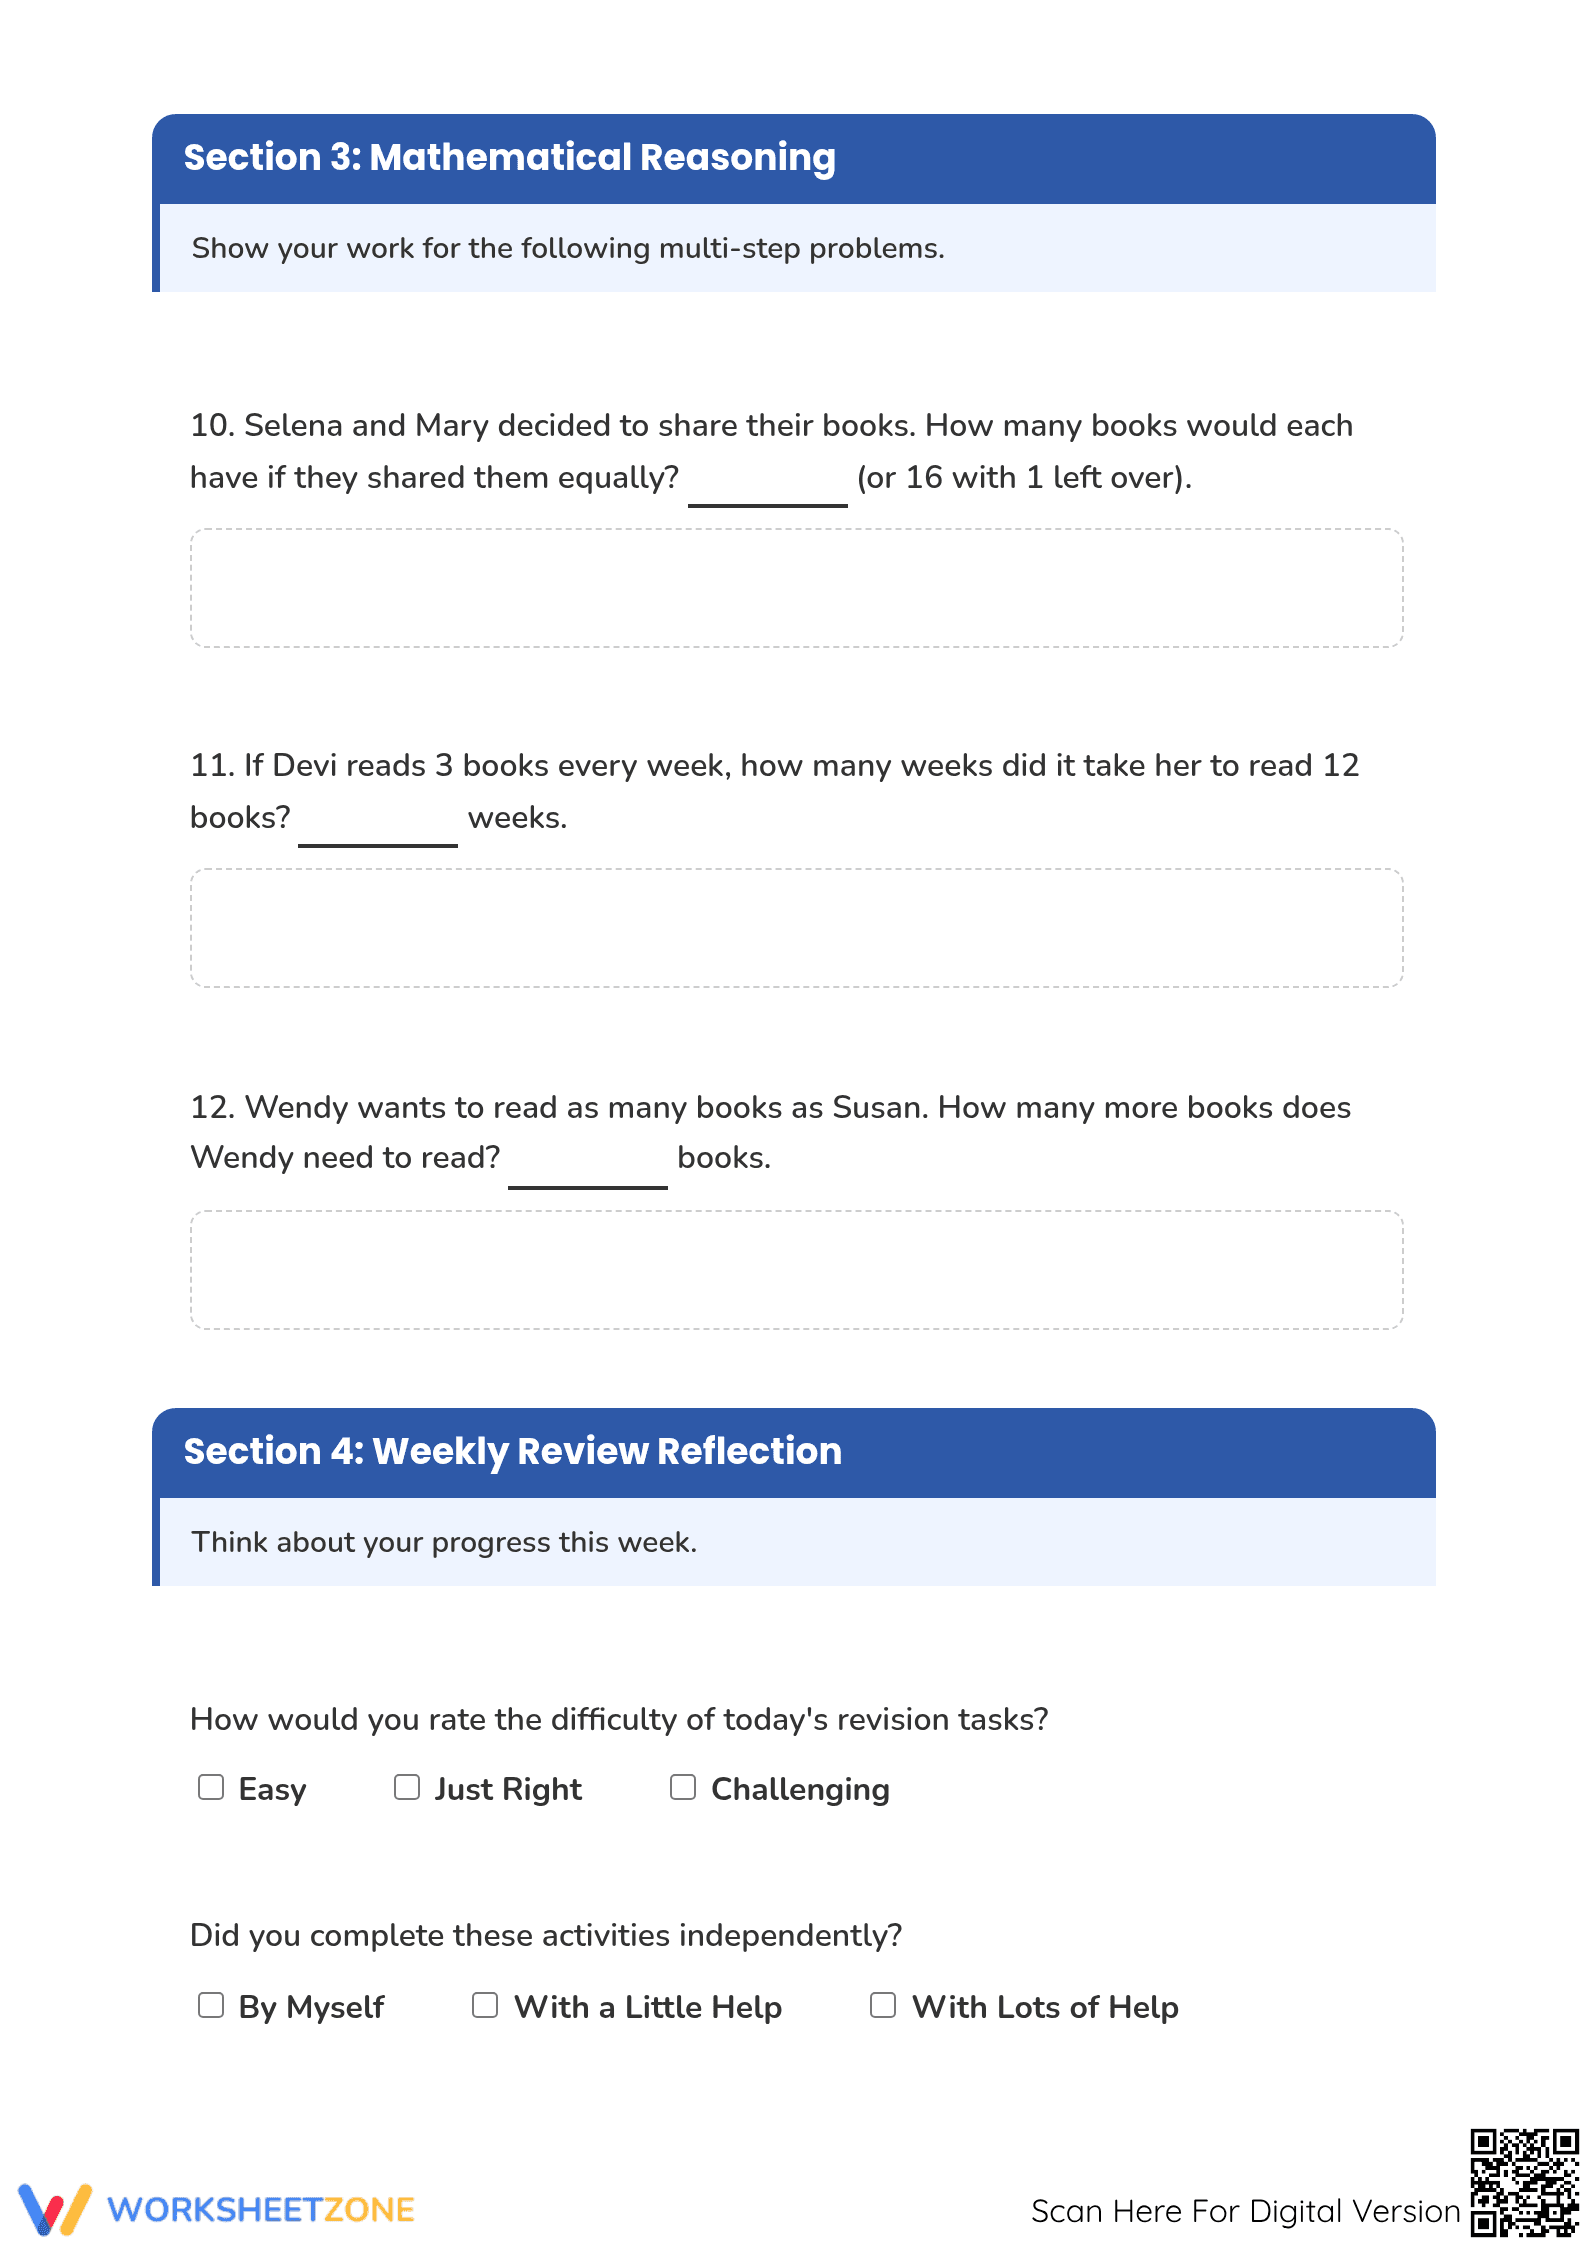
This Grade 5 bar graph revision worksheet provides students with 12 comprehensive tasks to master data interpretation and mathematical reasoning. Students analyze a real-world scenario involving books read to solve comparison, logic, and multi-step problems. It serves as a complete end-of-week assessment or independent practice tool to ensure mastery of data standards.
At a Glance
- Grade: 5 · Subject: Math
- Standard:
CCSS.MATH.CONTENT.5.MD.B.2— Make a line plot or graph to display and interpret data sets- Skill Focus: Bar Graph Interpretation
- Format: 3 pages · 12 problems · Answer key included · PDF
- Best For: Weekly revision or formative assessment
- Time: 20–30 minutes
The 3-page PDF includes a detailed bar graph followed by three distinct sections: Data Interpretation, Comparisons & Logic, and Mathematical Reasoning. It features 12 numbered questions ranging from simple identification to calculating the mean and solving multi-step division problems. A student reflection section and a full answer key are included for immediate feedback and self-monitoring.
Zero-Prep Workflow:
- Print: Select the 3-page PDF and print enough copies for your class in under 30 seconds.
- Distribute: Hand out the worksheets as a Friday Practice or independent center activity with zero teacher setup.
- Review: Use the included answer key to grade or have students self-correct their work in 5 minutes.
The primary focus is CCSS.MATH.CONTENT.5.MD.B.2, which requires students to represent and interpret data. This worksheet specifically targets the interpretation of whole-number data sets through comparative analysis and arithmetic operations. Students must demonstrate they can extract information from a visual display to solve real-world problems. Both standard codes can be copied directly into lesson plans, IEP goals, or district curriculum mapping tools.
Assign this worksheet during the independent practice phase of a lesson to evaluate individual student understanding of graphing. It also functions as a formative assessment; observe how students handle Question 9 (calculating the mean) to identify who needs additional support with averages. Completion typically takes 20 to 30 minutes depending on student familiarity with multi-step word problems.
Designed for Grade 5 students, this resource is also suitable for Grade 4 enrichment or Grade 6 intervention. It pairs naturally with a data-focused anchor chart or a direct instruction lesson on measures of center. The clear layout ensures accessibility for diverse learners while maintaining academic rigor.
According to the RAND AIRS 2024 report, high-quality curriculum-aligned materials significantly improve student outcomes in data literacy. This worksheet targets CCSS.MATH.CONTENT.5.MD.B.2, focusing on the essential skill of interpreting bar graphs to solve real-world problems. By integrating multi-step logic and calculations of the mean, the resource moves beyond simple data identification into higher-order analysis. Research from Fisher & Frey (2014) emphasizes that structured revision tasks like this Friday Practice reinforce the gradual release of responsibility, allowing students to demonstrate mastery independently. The inclusion of a reflection section aligns with metacognitive strategies proven to increase retention. This 3-page resource provides 12 rigorous tasks and a full answer key, ensuring it meets the criteria for classroom-ready, standards-aligned supplemental instruction in elementary mathematics.


