


0
Views
0
Downloads
0.0
0
Save
0 Likes
Proportional Relationships and Slope Worksheet
0 Views
0 Downloads
Paste this activity's link or code into your existing LMS (Google Classroom, Canvas, Teams, Schoology, Moodle, etc.).
Students can open and work on the activity right away, with no student login required.
You'll still be able to track student progress and results from your teacher account.
Information
Description
What It Is:
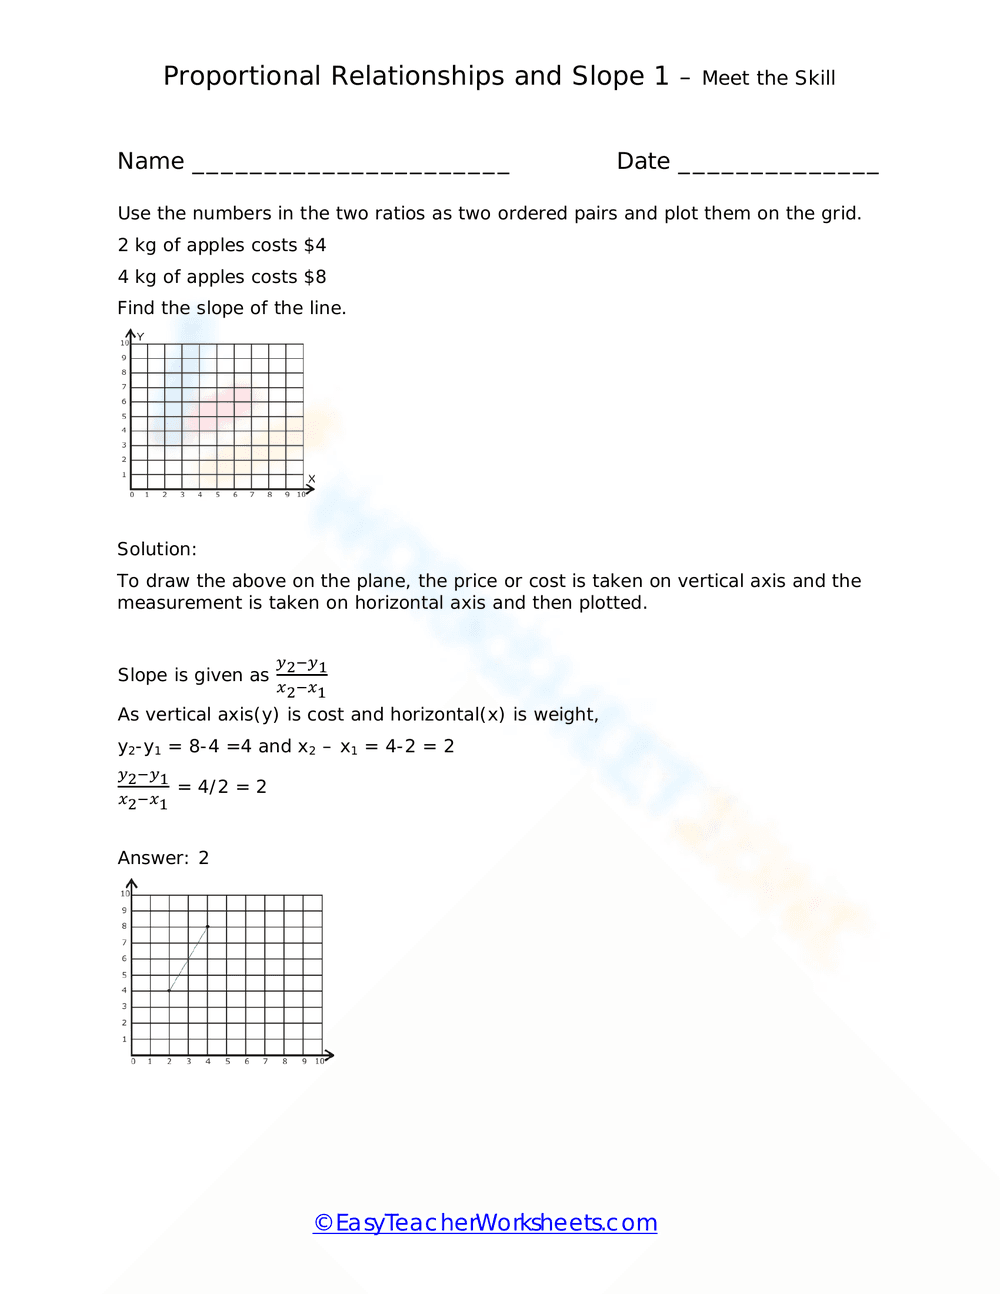
This is a math worksheet focusing on proportional relationships and slope. It presents a problem where students are given two ratios (2 kg of apples costs $4 and 4 kg of apples costs $8) and asked to plot them as ordered pairs on a grid and then find the slope of the line. The worksheet also provides a solution and formula for calculating slope.
Grade Level Suitability:
Suitable for 7th to 9th grade. It involves understanding of ratios, plotting points on a coordinate plane, and calculating slope, which are typically covered in these grades.
Why Use It:
This worksheet helps students understand the relationship between proportional relationships and slope. It provides practice in plotting points, interpreting data, and applying the slope formula in a real-world context (cost vs. weight). It also reinforces the concept of representing data graphically.
How to Use It:
Students should first plot the two given data points (2, 4) and (4, 8) on the provided grid. Then, they should draw a line connecting the two points. Finally, they should use the slope formula (rise over run) or the provided formula to calculate the slope of the line.
Target Users:
This worksheet is beneficial for students who are learning about proportional relationships, coordinate planes, and slope. It is also useful for teachers looking for practice problems to reinforce these concepts.