




























Views
Downloads




Printable Time-in-Stage Data Worksheet | Grade 9 Biology

Paste this activity's link or code into your existing LMS (Google Classroom, Canvas, Teams, Schoology, Moodle, etc.).
Students can open and work on the activity right away, with no student login required.
You'll still be able to track student progress and results from your teacher account.
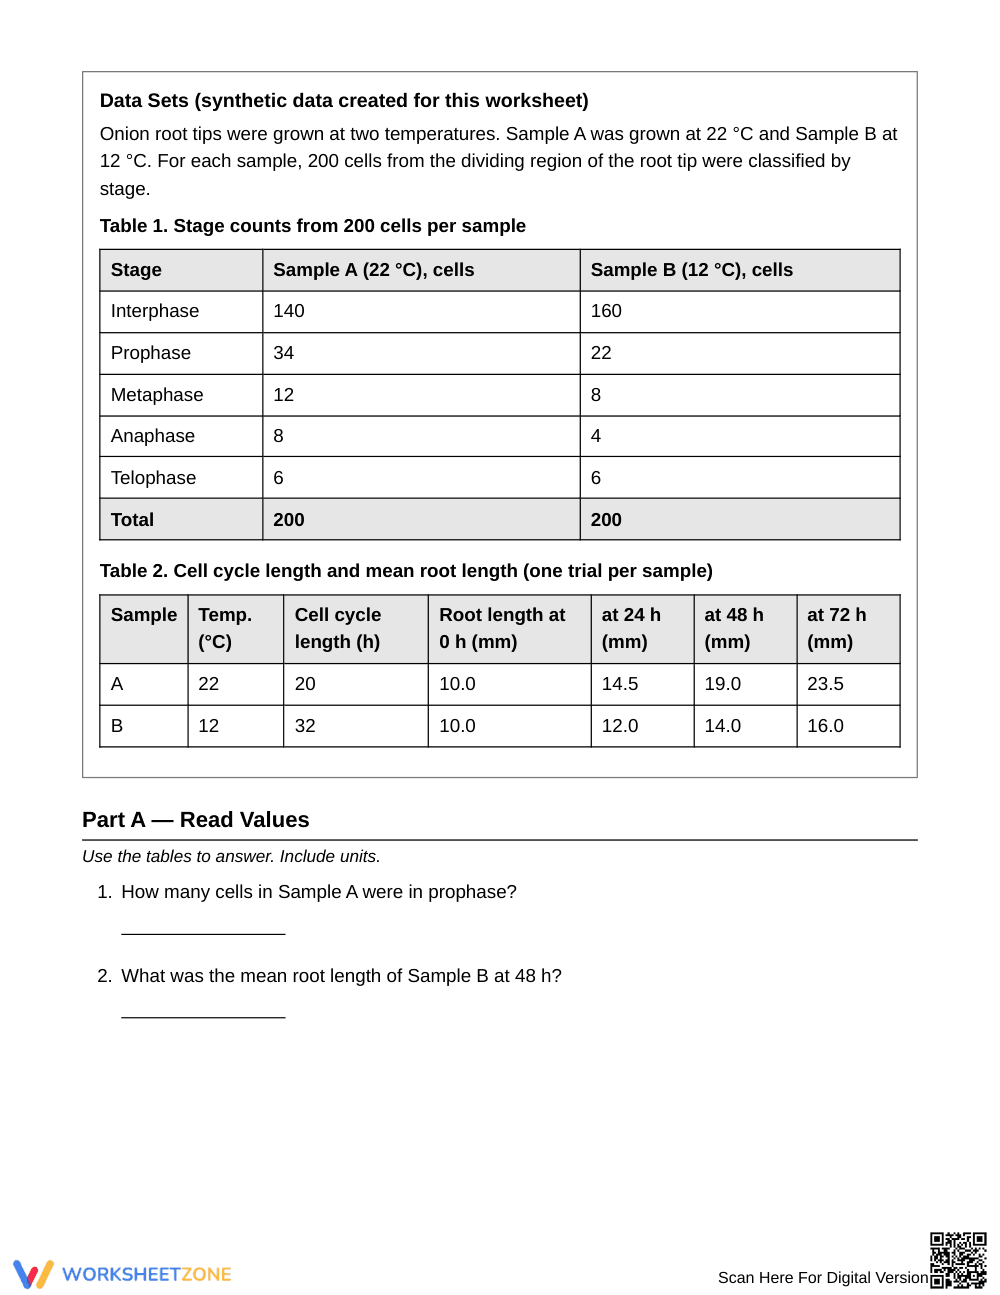
This worksheet teaches students to interpret time-in-stage data from the cell cycle. Using stage counts from onion root tips grown at two temperatures, students convert cell counts into estimated hours, compare mitosis with interphase, and judge what the data can and cannot show about cell division and root growth.
At a Glance
- Grade: 9 · Subject: Biology
- Standard: Not specified — students read stage-count tables and calculate time spent in each stage
- Skill Focus: Interpret time-in-stage data from cell counts and cycle length
- Format: 5 pages · 10 problems · Answer key included · PDF
- Best For: Data analysis after mitosis instruction
- Time: 40–50 minutes
What's Inside
The packet has 5 pages with a conventions box, two synthetic data tables (stage counts and root length), and 10 tasks: value reading, calculations, one multiple-choice item, and written evaluation. A 3-page answer key is included.
Skill Progression
- Guided practice (Part A, 2 tasks): Read values directly from the tables with units.
- Supported practice (Part B, 6 tasks): Calculate percentages, time in stage, chromosome counts, growth rates, and cycles per day, using the formula in the conventions box.
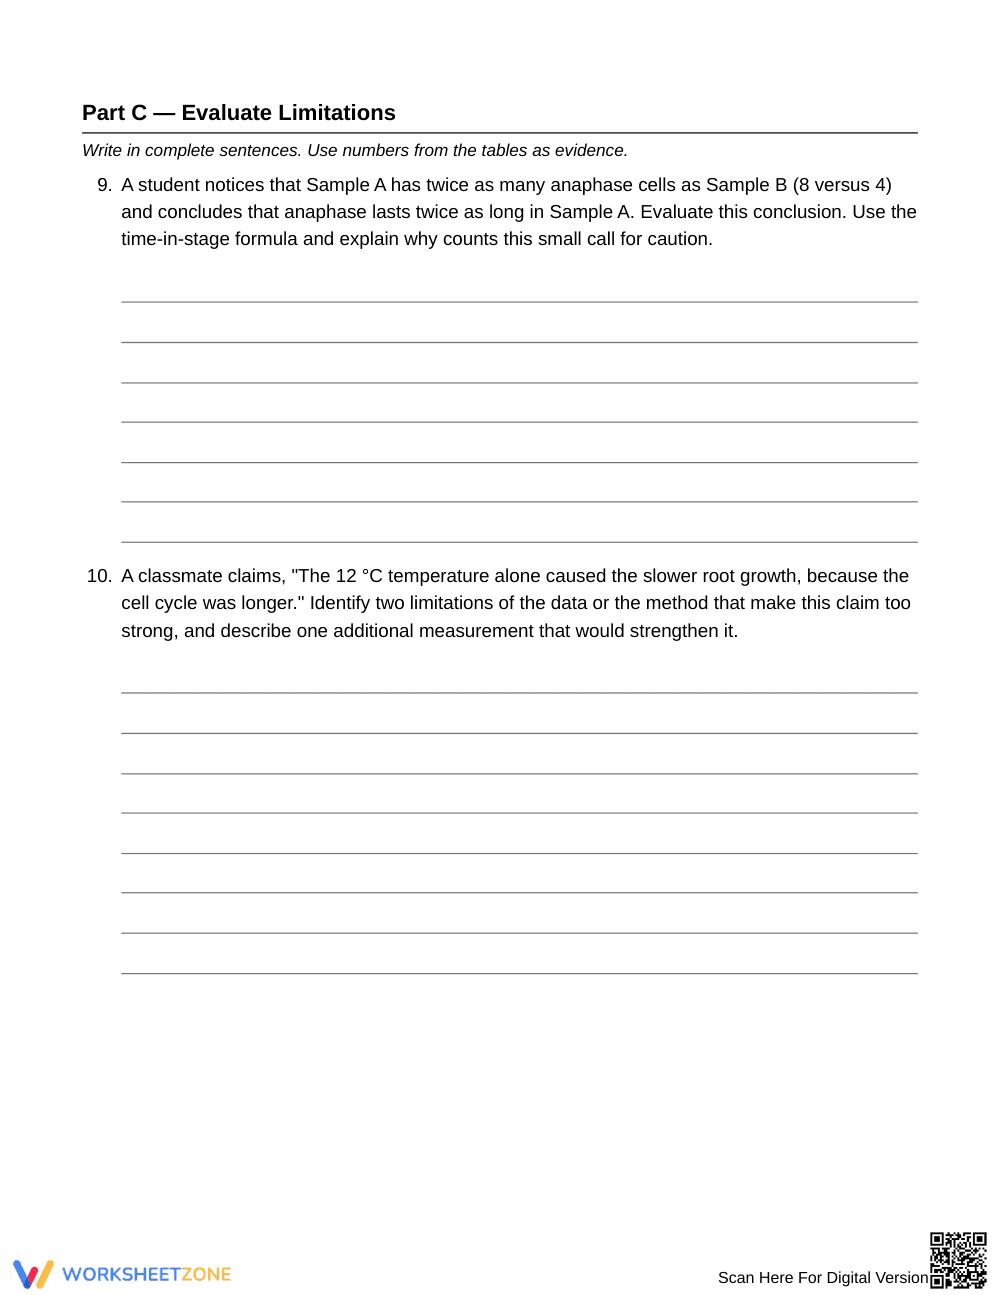
- Independent practice (Part C, 2 tasks): Evaluate claims and limitations in complete sentences, citing numbers as evidence.
This follows a gradual-release model: I Do, We Do, You Do.
Standards Alignment
No standard code was provided for this resource. The tasks target analyzing and interpreting data about the cell cycle and mitosis, and using evidence to evaluate claims. Add your local standard code when copying this into lesson plans, IEP goals, or district curriculum mapping tools.
How to Use It
- After direct instruction: Assign Parts A and B as independent practice once students can name the stages of mitosis.
- Before a unit assessment: Use Part C as a short written review or discussion starter.
Formative tip: while students work, check whether they divide by total cells counted rather than by the interphase count. Expect 40–50 minutes in total.
Who It's For
Grade 9 Biology students studying the cell cycle. Students who struggle with multi-step calculations can work Parts A and B first, and the conventions box supports the math. Pair it with a mitosis stages anchor chart or a root-tip micrograph lesson.
The Grade 9 Biology worksheet Reading Time-in-Stage Data teaches students to convert stage counts into estimated time in each phase of the cell cycle, using time in stage = (cells in stage ÷ total cells counted) × cell cycle length. Ten tasks across five pages use synthetic onion root-tip data from 22 °C and 12 °C samples, with 200 cells each. Students calculate percentages, hours, chromosome counts, and growth rates, then evaluate limitations such as small counts and a single trial. The sequence follows the gradual release model described by Fisher & Frey (2014), moving from guided value reading to supported calculation and independent evaluation. An answer key is included. No standard code was supplied for this resource, so teachers should add their local code when aligning it. It fits high school biology units on mitosis and data literacy.


