


Views
Downloads
Printable Pie Graph Worksheet | Grade 1 Math Data
Paste this activity's link or code into your existing LMS (Google Classroom, Canvas, Teams, Schoology, Moodle, etc.).
Students can open and work on the activity right away, with no student login required.
You'll still be able to track student progress and results from your teacher account.
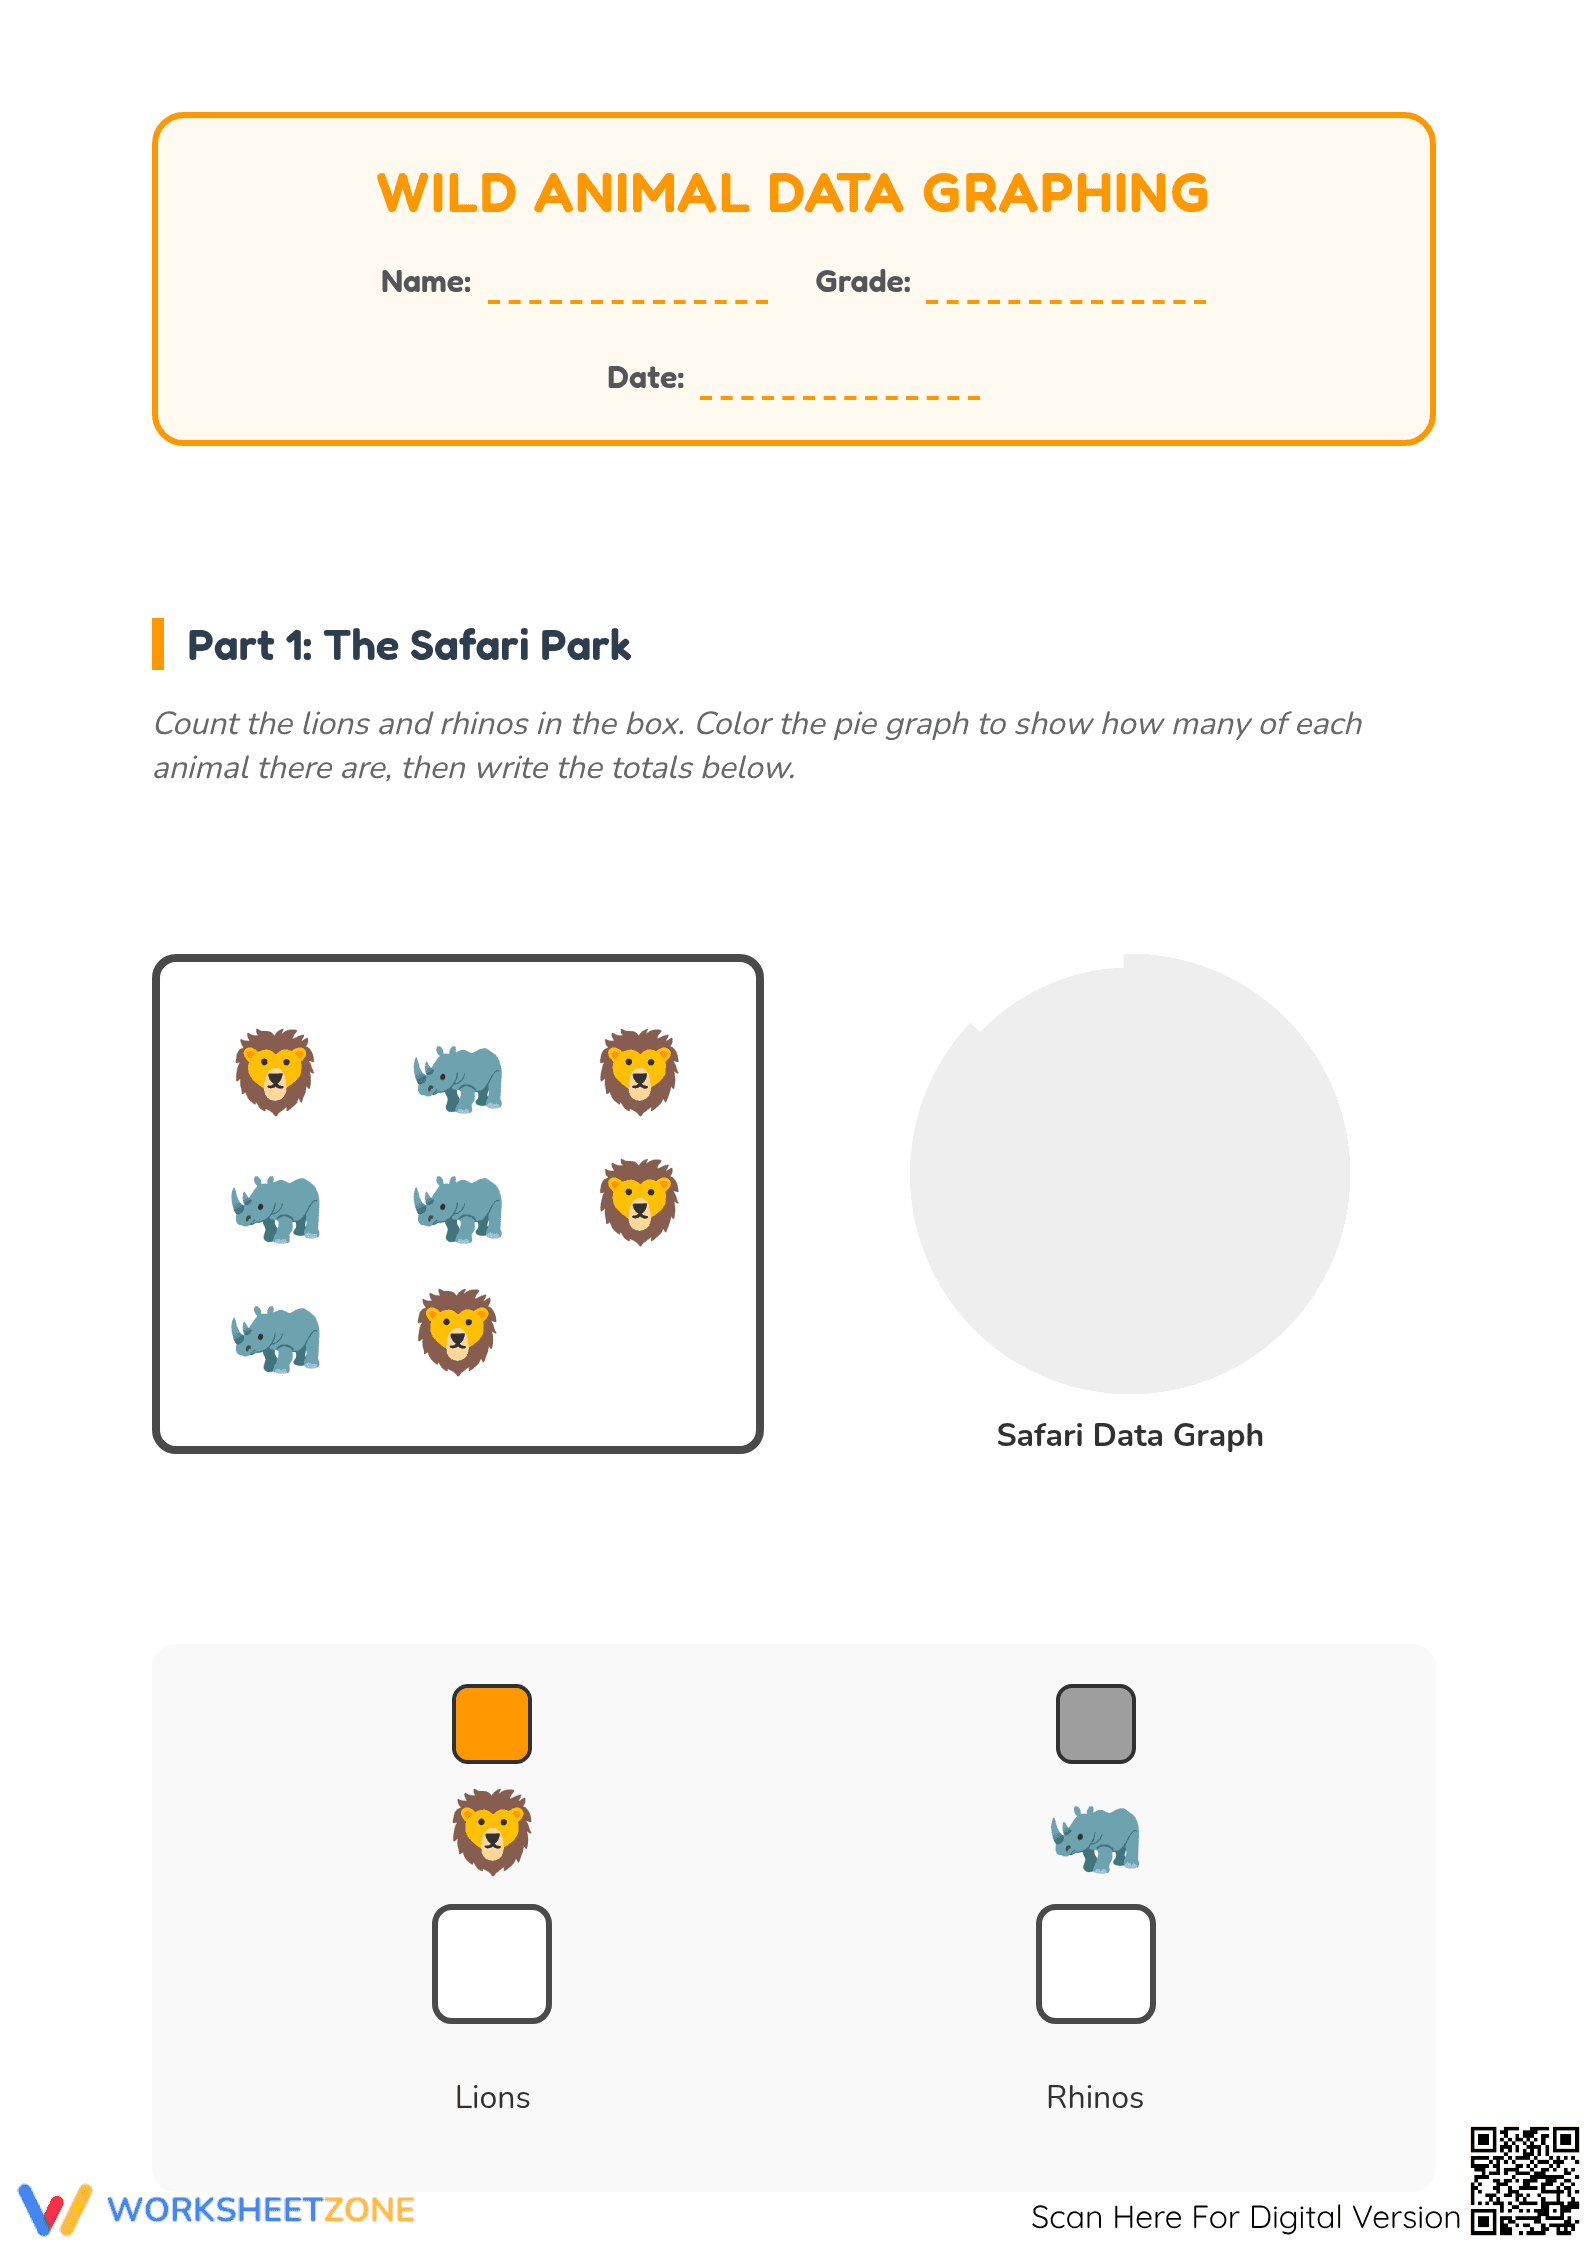
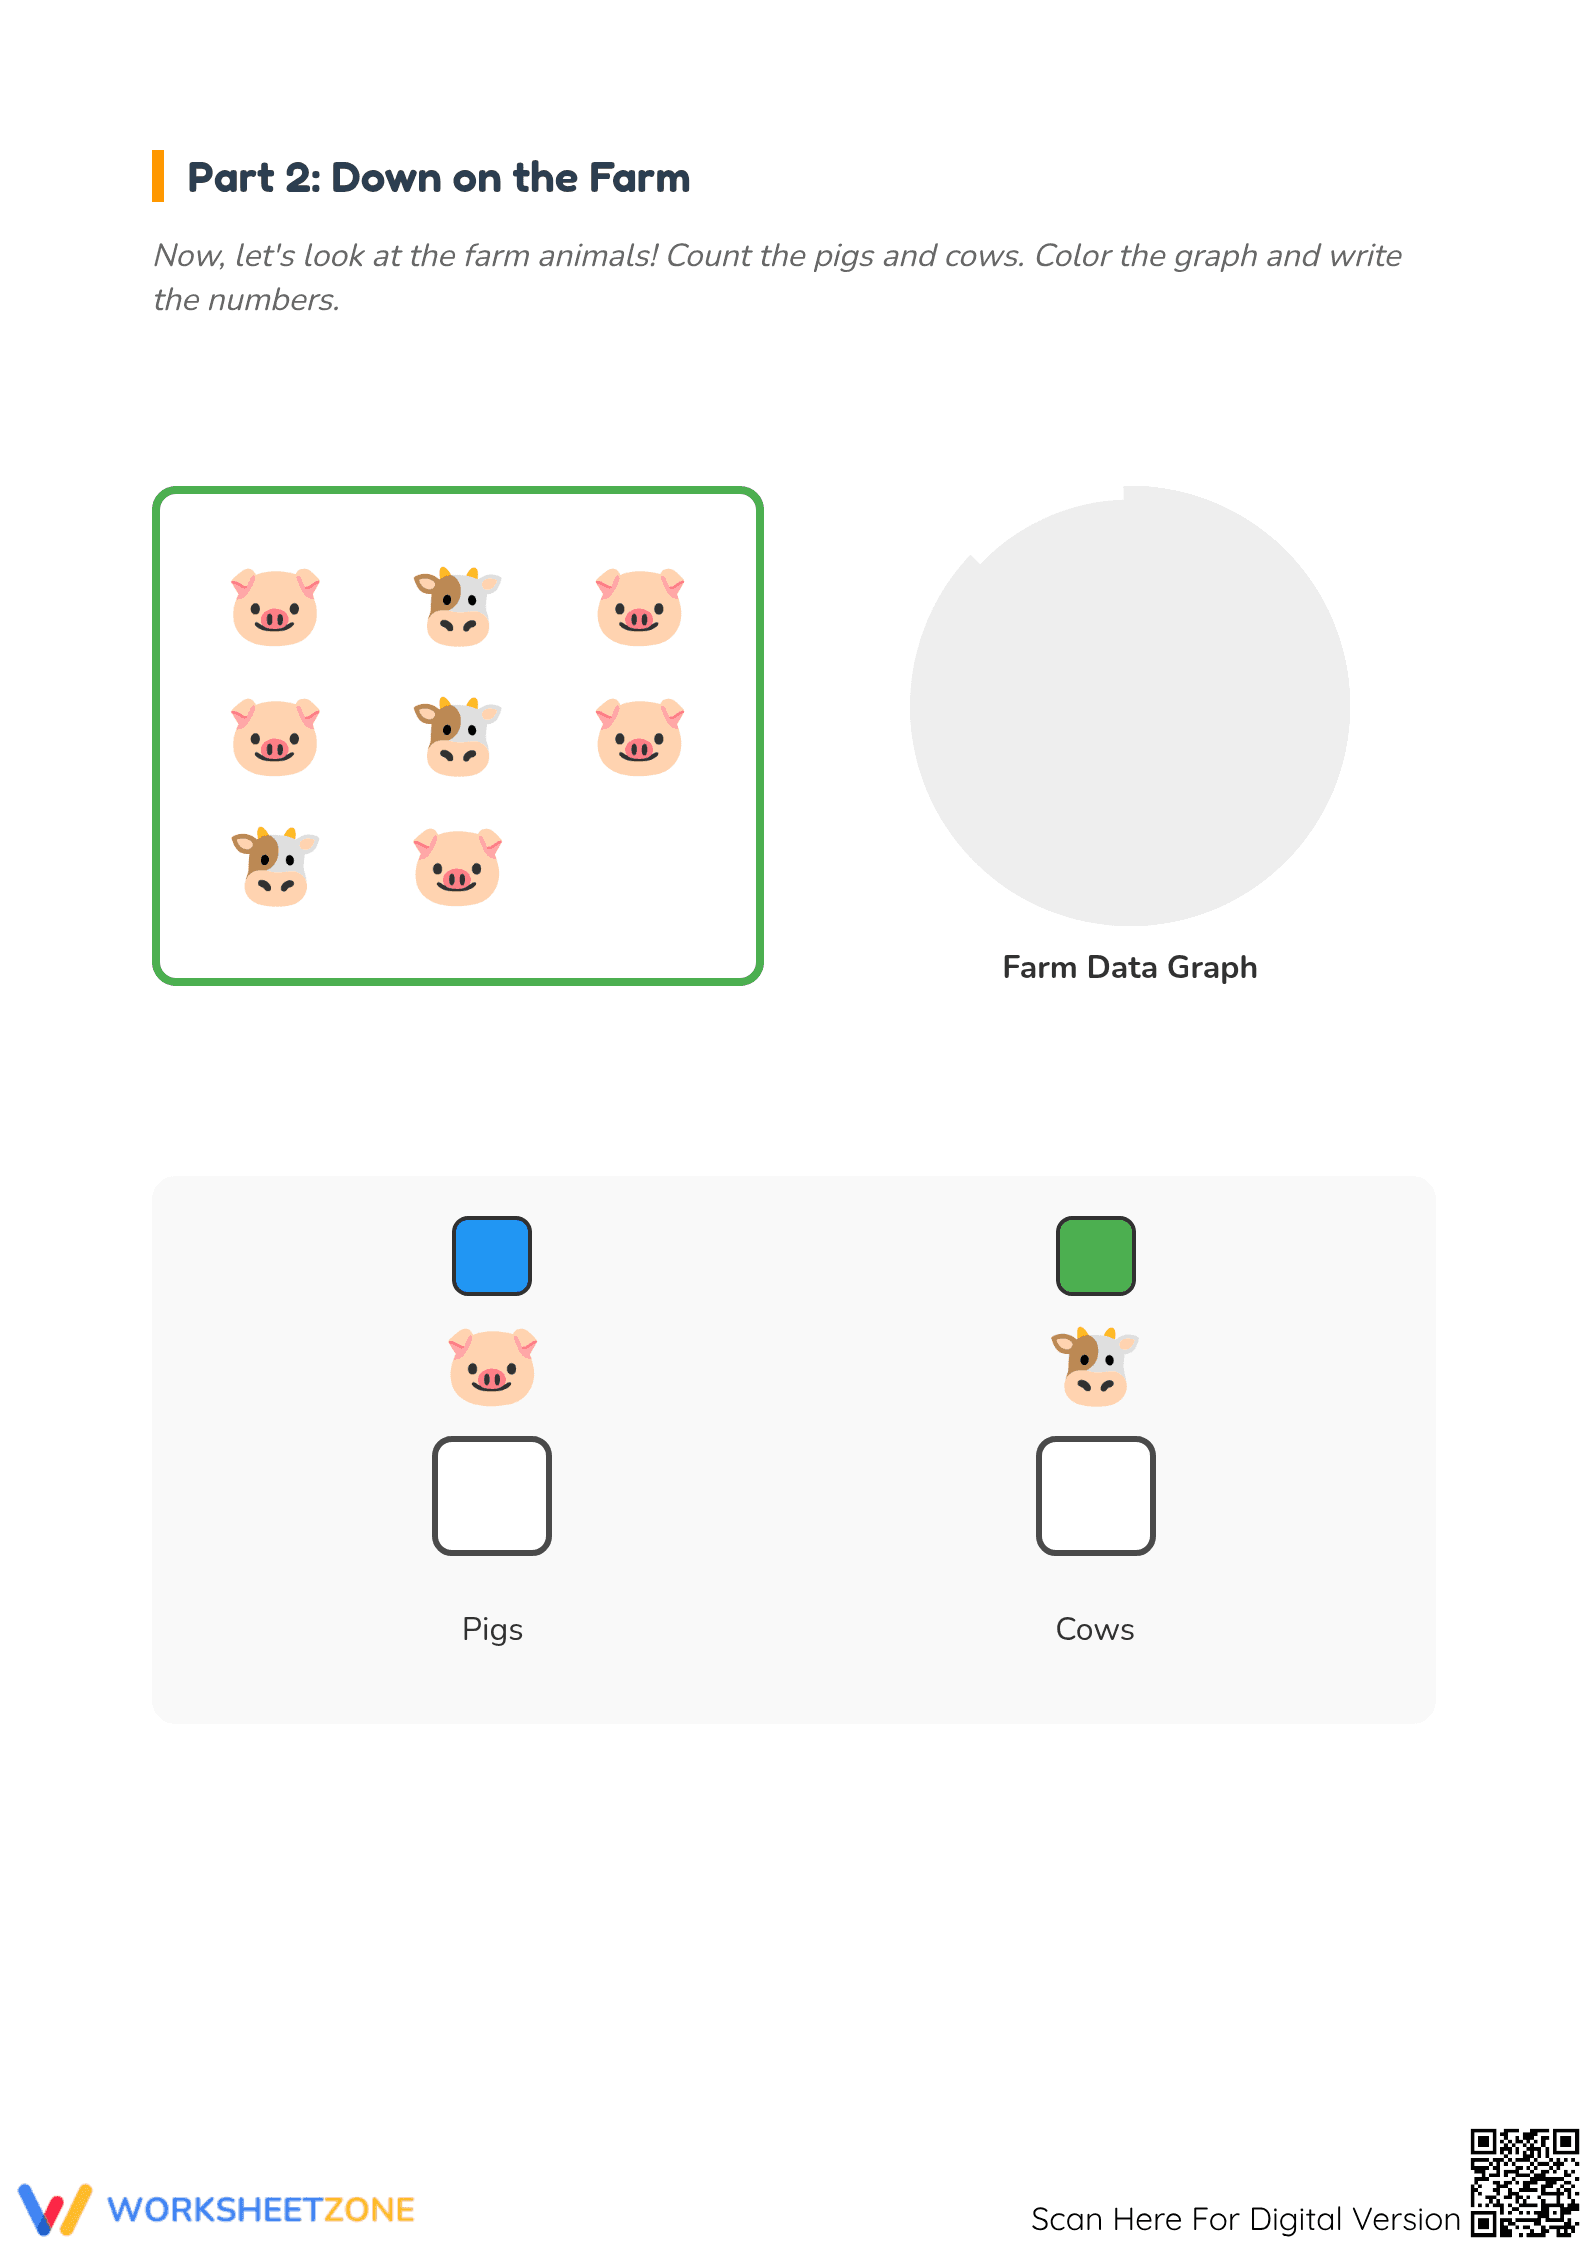
This Grade 1 math worksheet provides a foundational introduction to data representation through simplified pie graphs. Students engage in counting wild and farm animals before translating those totals into a visual circular graph. By bridging the gap between concrete counting and abstract data visualization, this resource ensures early learners grasp how information is organized and shared.
At a Glance
- Grade: 1 · Subject: Math
- Standard:
CCSS.MATH.CONTENT.1.MD.C.4— Organize, represent, and interpret data with up to three categories- Skill Focus: Pie graph representation
- Format: 2 pages · 2 data sets · Answer key included · PDF
- Best For: Introduction to data visualization
- Time: 15–20 minutes
The worksheet contains two distinct pages of practice. Part 1 features a "Safari Park" theme where students count lions and rhinos. Part 2 moves "Down on the Farm" to count pigs and cows. Each page includes a clear counting box, a segmented pie graph for coloring, and dedicated spaces to write numerical totals. The inclusion of a full answer key allows for quick grading or student self-correction.
This resource is designed for a zero-prep classroom workflow. First, print the two-page PDF (30 seconds). Second, distribute the sheets to students along with crayons or colored pencils (1 minute). Third, review the completed graphs as a whole class to discuss which animal had the higher count (5 minutes). Total teacher preparation time is under 2 minutes, making it an ideal choice for morning work or emergency sub plans.
Aligned to `CCSS.MATH.CONTENT.1.MD.C.4`, this worksheet requires students to organize and represent data. While many primary resources focus exclusively on bar graphs, this activity introduces the concept of parts-of-a-whole through a simplified pie chart. Both standard codes can be copied directly into lesson plans, IEP goals, or district curriculum mapping tools.
Use this worksheet during the "independent practice" phase of a math lesson on data. It works exceptionally well as a formative assessment after a whole-group lesson using physical manipulatives. Teachers should observe if students can accurately match the number of colored segments in the pie graph to the numerical count they wrote in the boxes. Completion typically takes 15 to 20 minutes.
This resource is tailored for Grade 1 students but is highly effective for Kindergarteners ready for a challenge or Grade 2 students needing a visual review. It is particularly helpful for visual learners who benefit from seeing data represented in different geometric shapes. Pair this with a physical sorting activity using plastic animal counters for a comprehensive learning experience.
According to the NAEP framework for mathematics, early exposure to data analysis is critical for developing statistical literacy in later grades. This worksheet aligns with the "I Do, We Do, You Do" instructional model by providing clear visual cues and structured tasks that reduce cognitive load. Research from Fisher & Frey (2014) emphasizes that scaffolded data representation tasks help students transition from basic counting to higher-order interpretation. By requiring students to count, write, and color, the activity engages multiple neural pathways, reinforcing the relationship between quantity and symbolic representation. The use of familiar animal themes further increases student engagement, which is a key predictor of mathematical persistence in early childhood education. This specific resource provides 2 distinct opportunities for mastery, ensuring that the standard CCSS.MATH.CONTENT.1.MD.C.4 is addressed through both numerical and visual modalities, supporting diverse learners in the primary classroom environment.