


Views
Downloads
Kinematics Graphs Worksheet | Essential Physics Practice
Paste this activity's link or code into your existing LMS (Google Classroom, Canvas, Teams, Schoology, Moodle, etc.).
Students can open and work on the activity right away, with no student login required.
You'll still be able to track student progress and results from your teacher account.
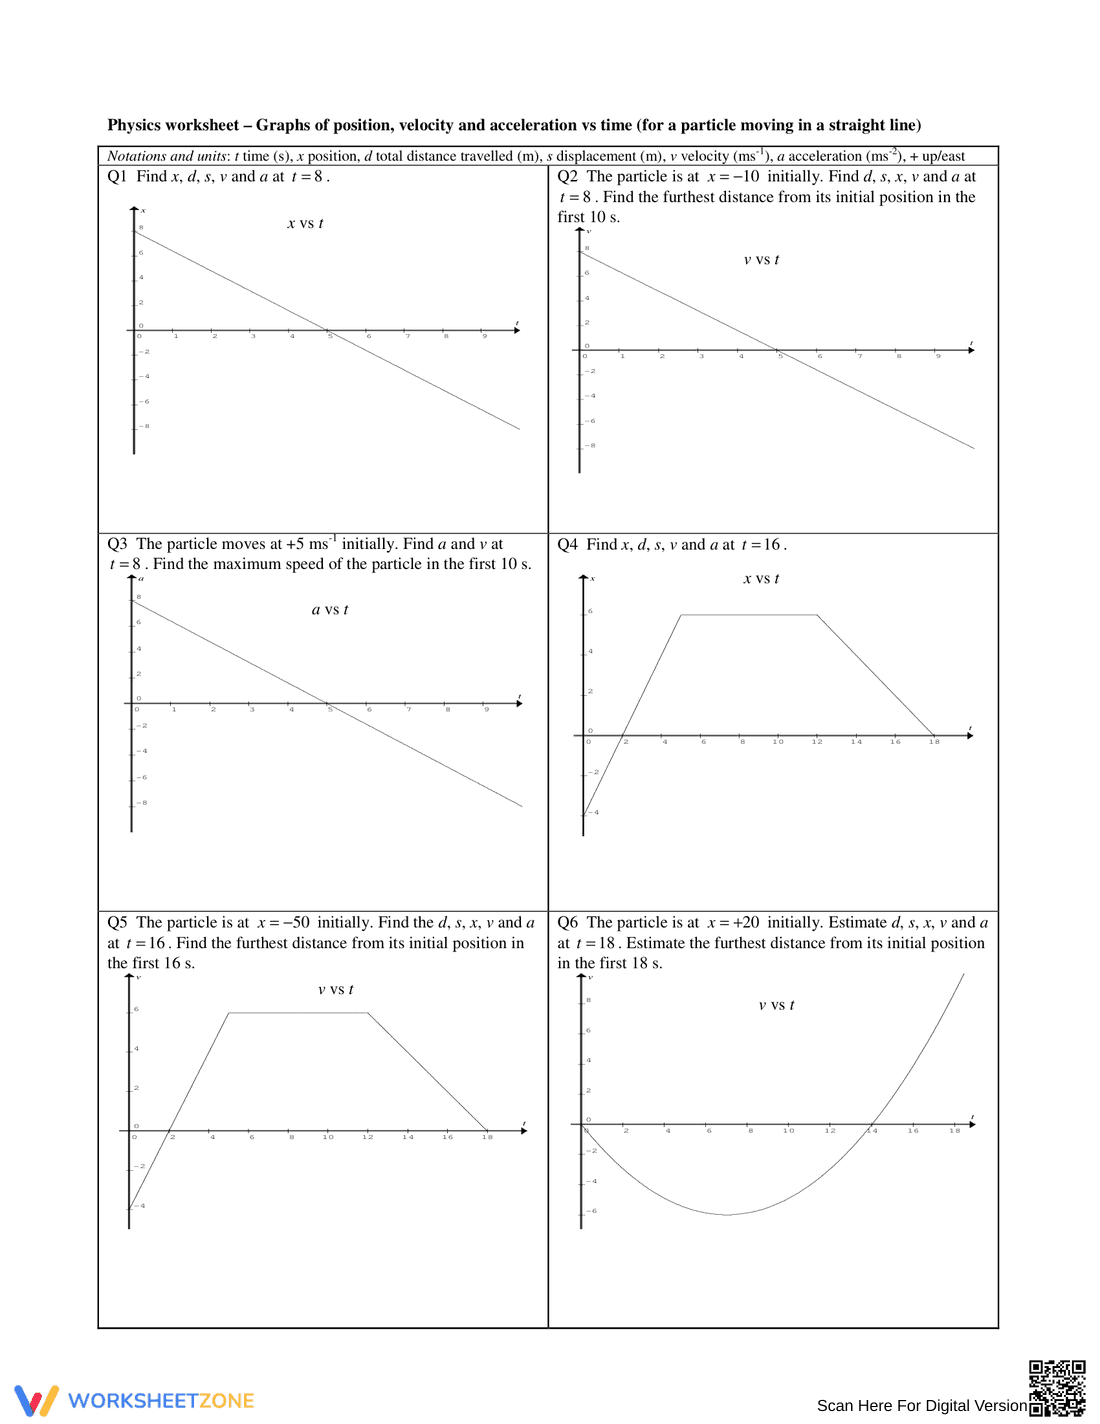
This high school physics worksheet provides rigorous practice for interpreting and calculating values from kinematics graphs. Students will analyze position-time, velocity-time, and acceleration-time graphs to determine displacement, distance, and instantaneous motion values. By the end of these exercises, learners will demonstrate a clear understanding of how different motion variables relate to one another in a straight-line system.
At a Glance
- Grade: 9–12 · Subject: Physics
- Standard:
HS-PS2-1— Analyze motion data to describe relationships between position, velocity, and acceleration.- Skill Focus: Kinematics Graph Interpretation
- Format: 1 page · 6 problems · Answer key included · PDF
- Best For: Independent practice or formative assessment
- Time: 30–45 minutes
The worksheet contains six multi-part problems that challenge students to extract numerical data from visual representations. Each task includes a specific graph type, such as x vs t or v vs t, and requires the calculation of multiple variables including total distance traveled and acceleration at specific time intervals. The layout is clean and focused, ensuring students remain engaged with the data analysis without unnecessary distractions.
Zero-Prep Workflow
- Print (1 minute): Download the PDF and print enough copies for your class; the single-page format keeps paper usage low.
- Distribute (1 minute): Hand out the sheets as a bell-ringer or a main lesson activity; no additional materials are required beyond a pencil and calculator.
- Review (5 minutes): Use the included answer key to quickly grade submissions or lead a whole-class review of the most challenging graphical transitions.
Standards Alignment
This resource is aligned to HS-PS2-1, which requires students to analyze data to support mathematical relationships in motion. It specifically targets the ability to derive acceleration and velocity from graphical slopes and areas. This standard code can be copied directly into lesson plans, IEP goals, or district curriculum mapping tools.
How to Use It
Assign this worksheet during the middle of your kinematics unit after students have been introduced to the basic definitions of velocity and acceleration. It serves as an excellent formative assessment tool; observe students as they calculate the area under a velocity-time graph to see if they correctly identify it as displacement. Expect most students to complete the six problems within a standard 45-minute class period.
Who It's For
This resource is designed for high school students in General Physics, Honors Physics, or AP Physics 1. It is particularly useful for learners who need to strengthen their graphical literacy. Pair this worksheet with a motion sensor lab or a digital simulation to provide a concrete connection between physical movement and abstract data plotting.
According to Fisher & Frey (2014), the use of visual data representations like kinematics graphs is a critical component of disciplinary literacy in the sciences. This worksheet, aligned to standard HS-PS2-1, requires students to translate between graphical representations and numerical values for position, distance, displacement, velocity, and acceleration. By engaging with six distinct scenarios—ranging from constant velocity to non-linear acceleration—learners develop the cognitive flexibility needed to interpret complex physical systems. Research indicates that structured practice with multi-variable graphs improves a student's ability to predict object behavior in real-world contexts. This resource provides the necessary scaffolding for high school learners to move from basic identification to advanced calculation. The inclusion of acceleration-versus-time and velocity-versus-time graphs ensures that students meet the rigorous demands of college-preparatory physics. Educators can utilize this standalone summary to justify the integration of graphical analysis into their core curriculum or individualized education programs.