


Views
Downloads
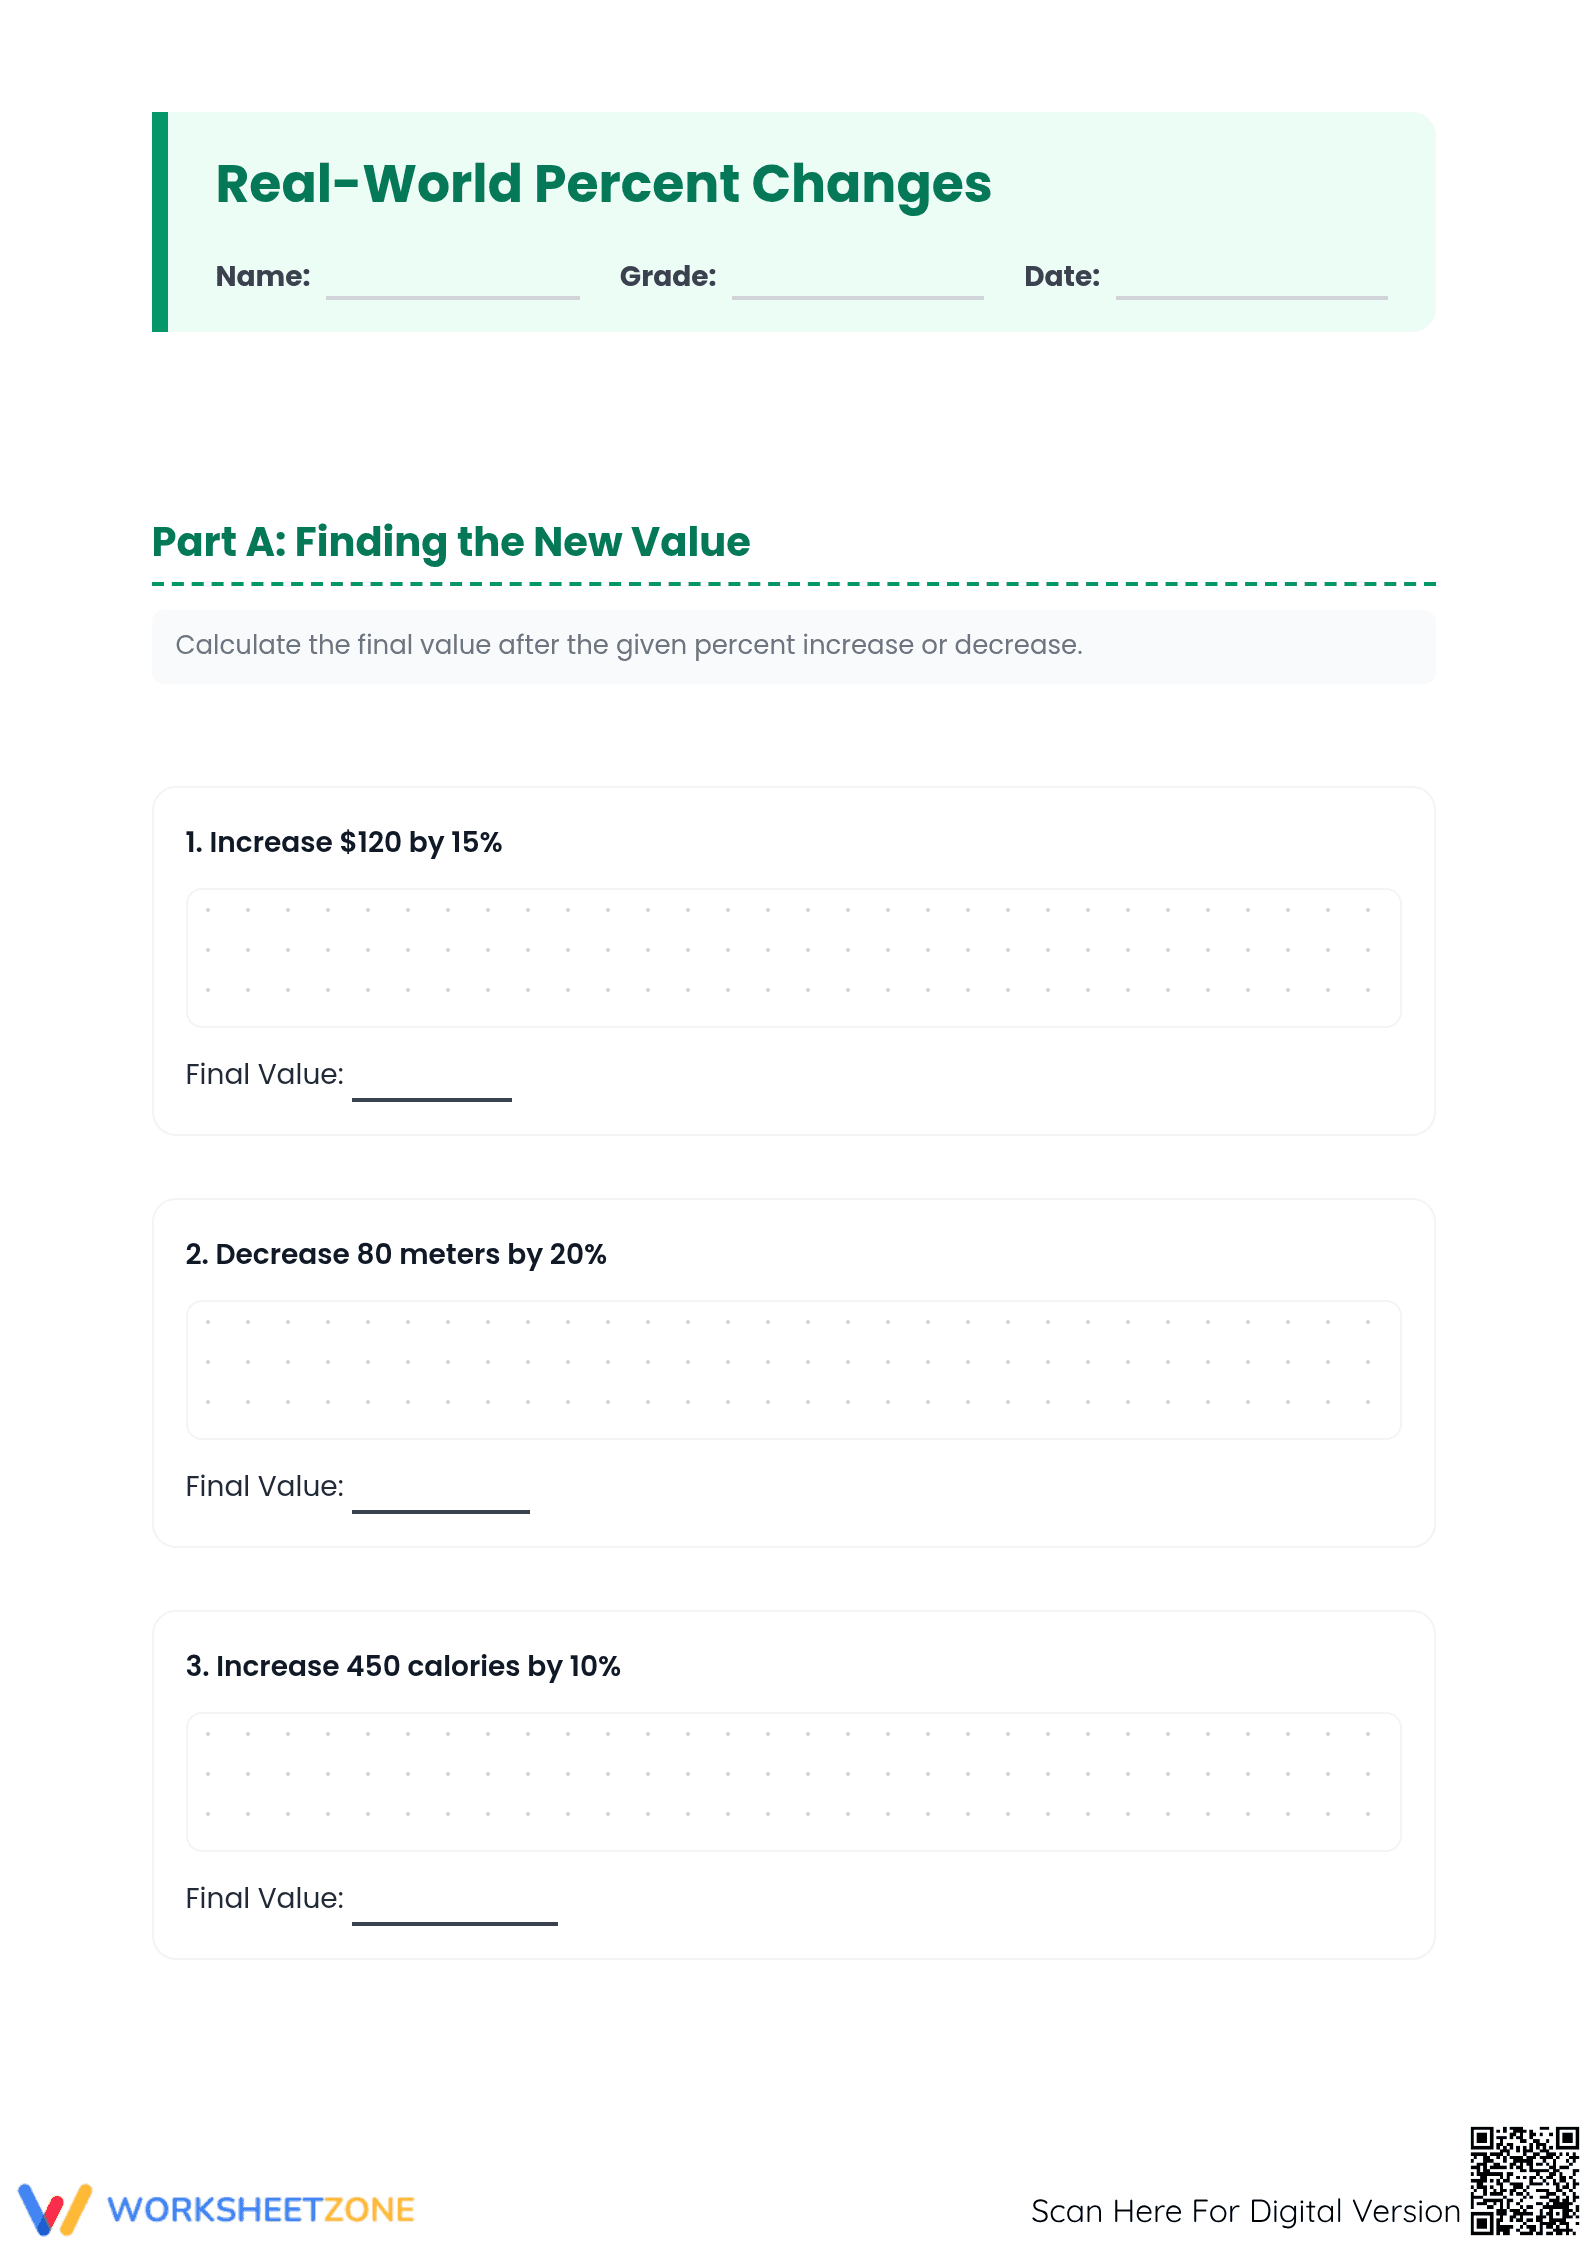
Essential 7.RP.A.3 Worksheet: Real-World Percent Changes
Paste this activity's link or code into your existing LMS (Google Classroom, Canvas, Teams, Schoology, Moodle, etc.).
Students can open and work on the activity right away, with no student login required.
You'll still be able to track student progress and results from your teacher account.
Mastering proportional relationships requires students to apply percentage concepts to tangible, real-world scenarios. This comprehensive worksheet guides middle schoolers through calculating percent increase and decrease, transitioning from basic value adjustments to complex inverse problems. By completing these 15 structured exercises, students develop the computational fluency needed for advanced financial literacy and algebraic reasoning.
At a Glance
- Grade: 7 · Subject: Math
- Standard:
7.RP.A.3— Use proportional relationships to solve multi-step ratio and percent problems like markups and decreases- Skill Focus: Real-world percent increase and decrease calculations
- Format: 5 pages · 15 problems · Answer key included · PDF
- Best For: Middle school ratio and proportion units
- Time: 45–60 minutes
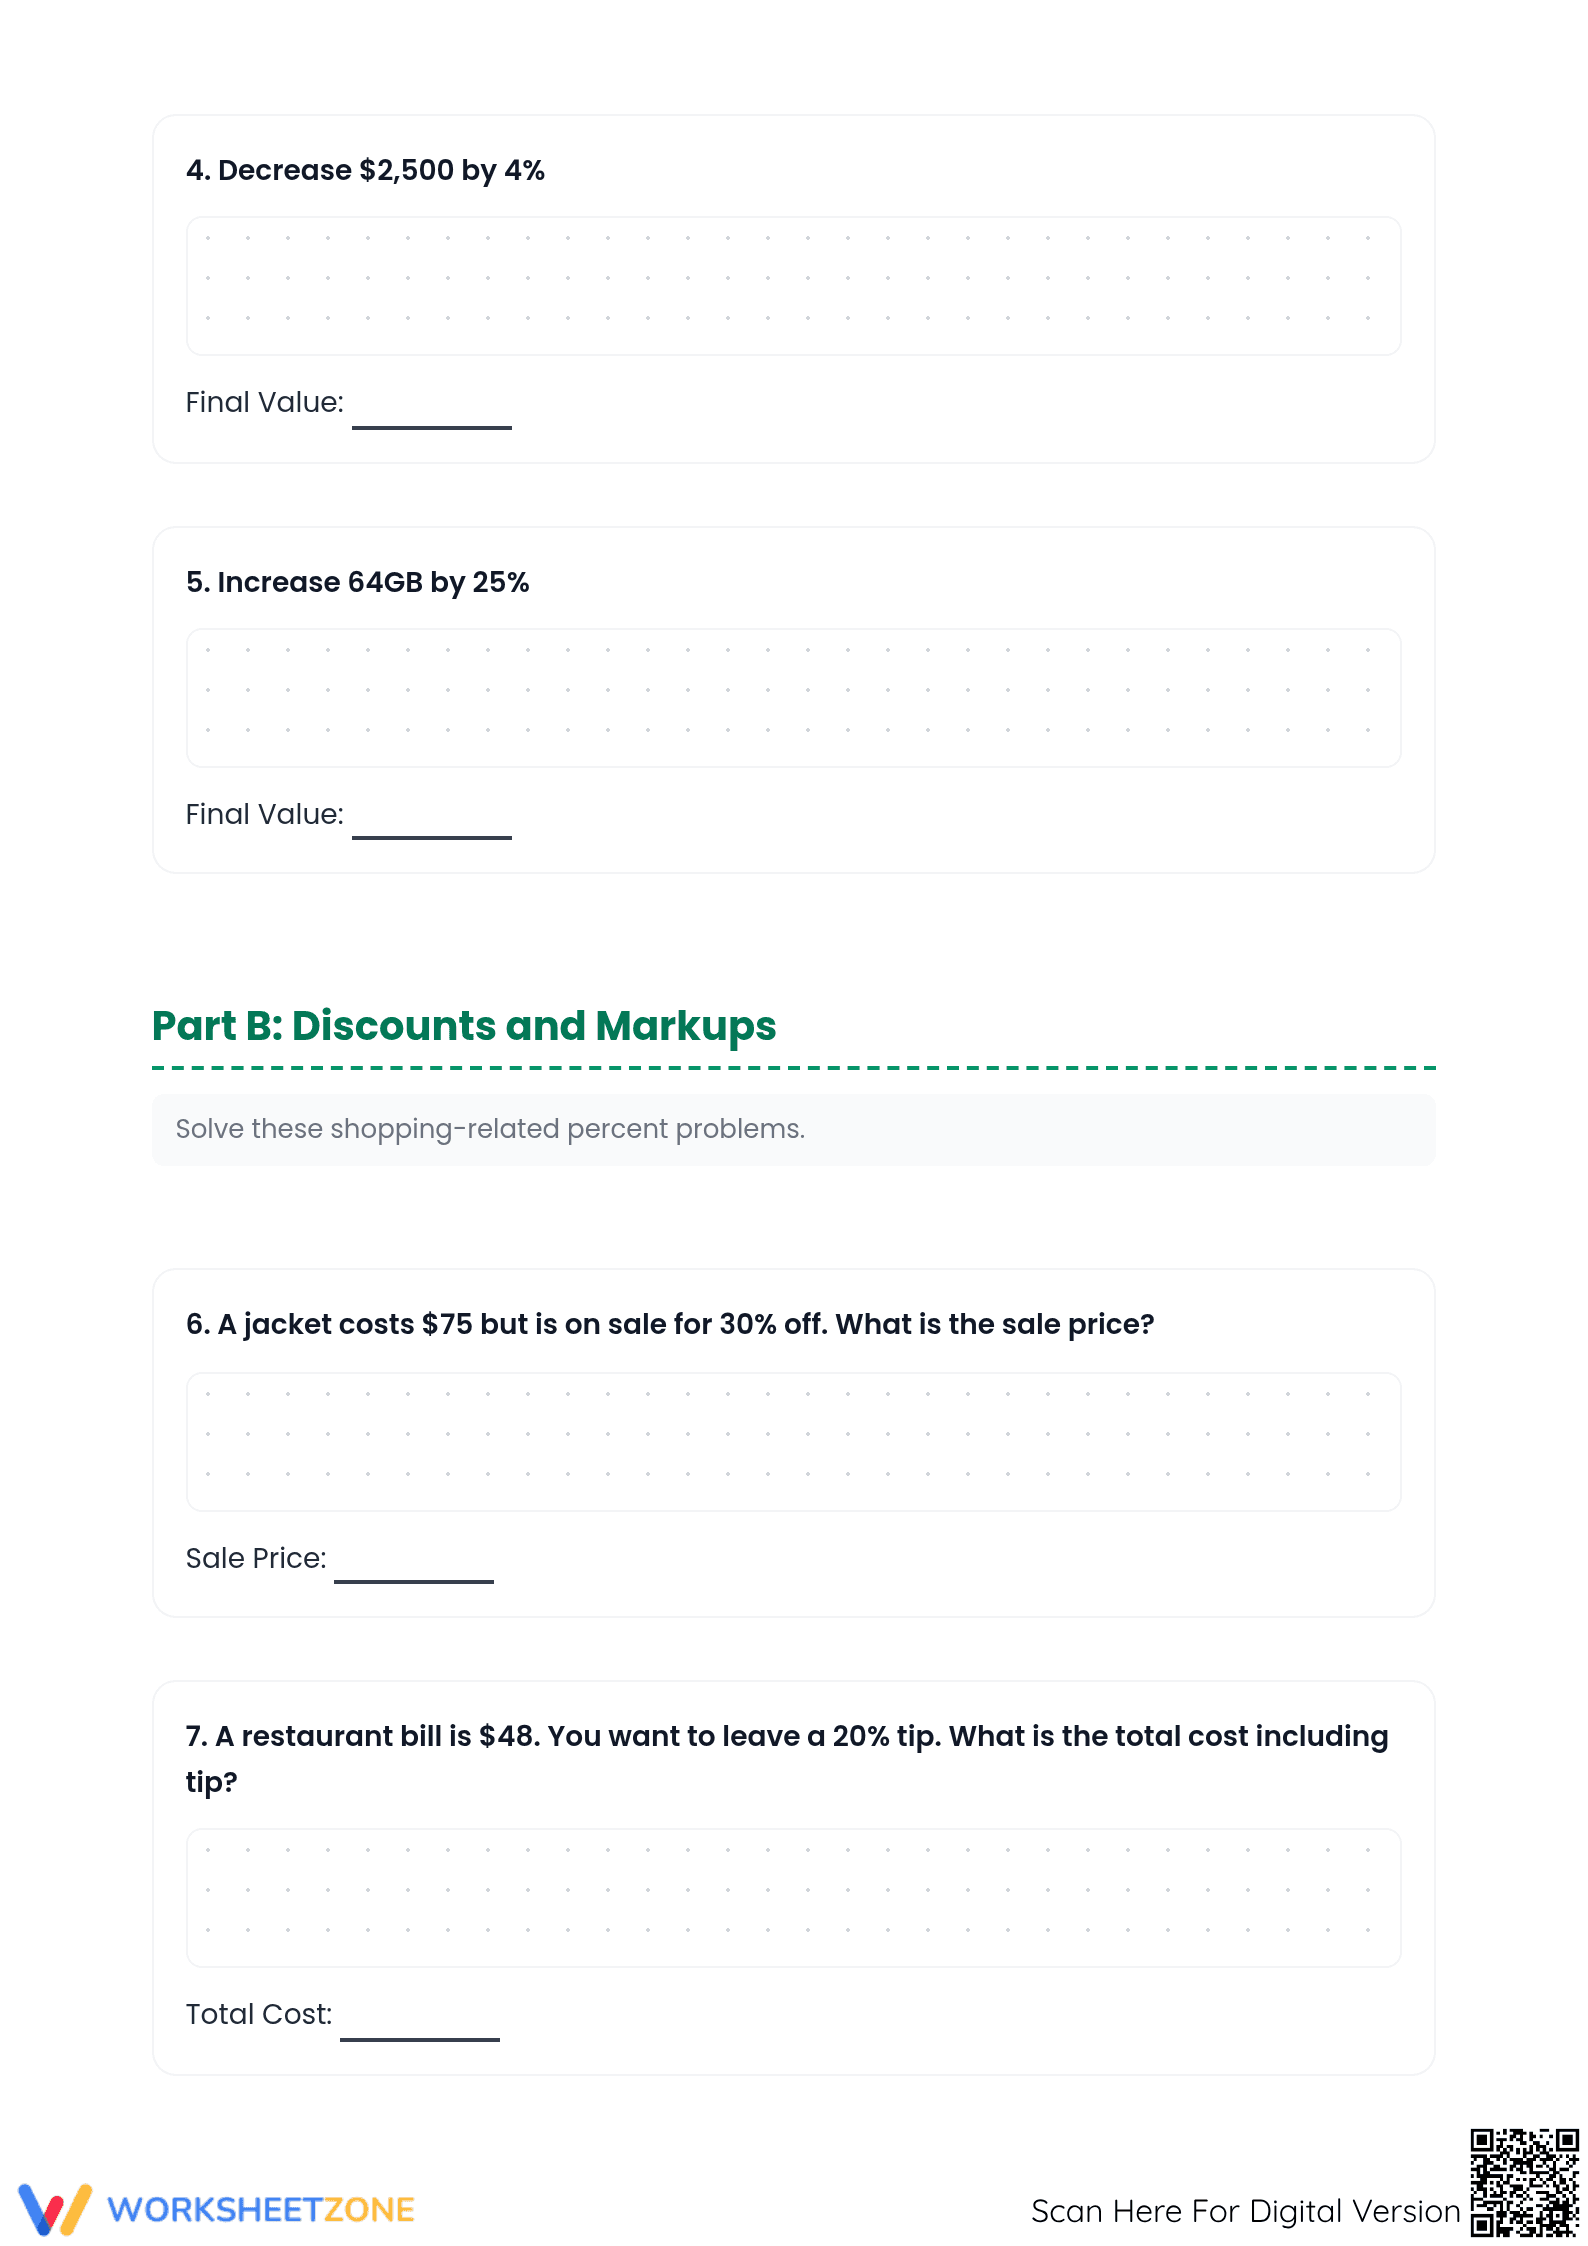
What's Inside: This five-page instructional packet is organized into four distinct modules that increase in cognitive demand. It features 15 real-world scenarios ranging from simple metric changes to complex consumer math. Each problem provides dedicated workspace with a dot-grid background to encourage organized calculations. A full answer key is included, providing the final values for every problem to facilitate quick grading or student self-correction.
Mastery Evidence and Progression
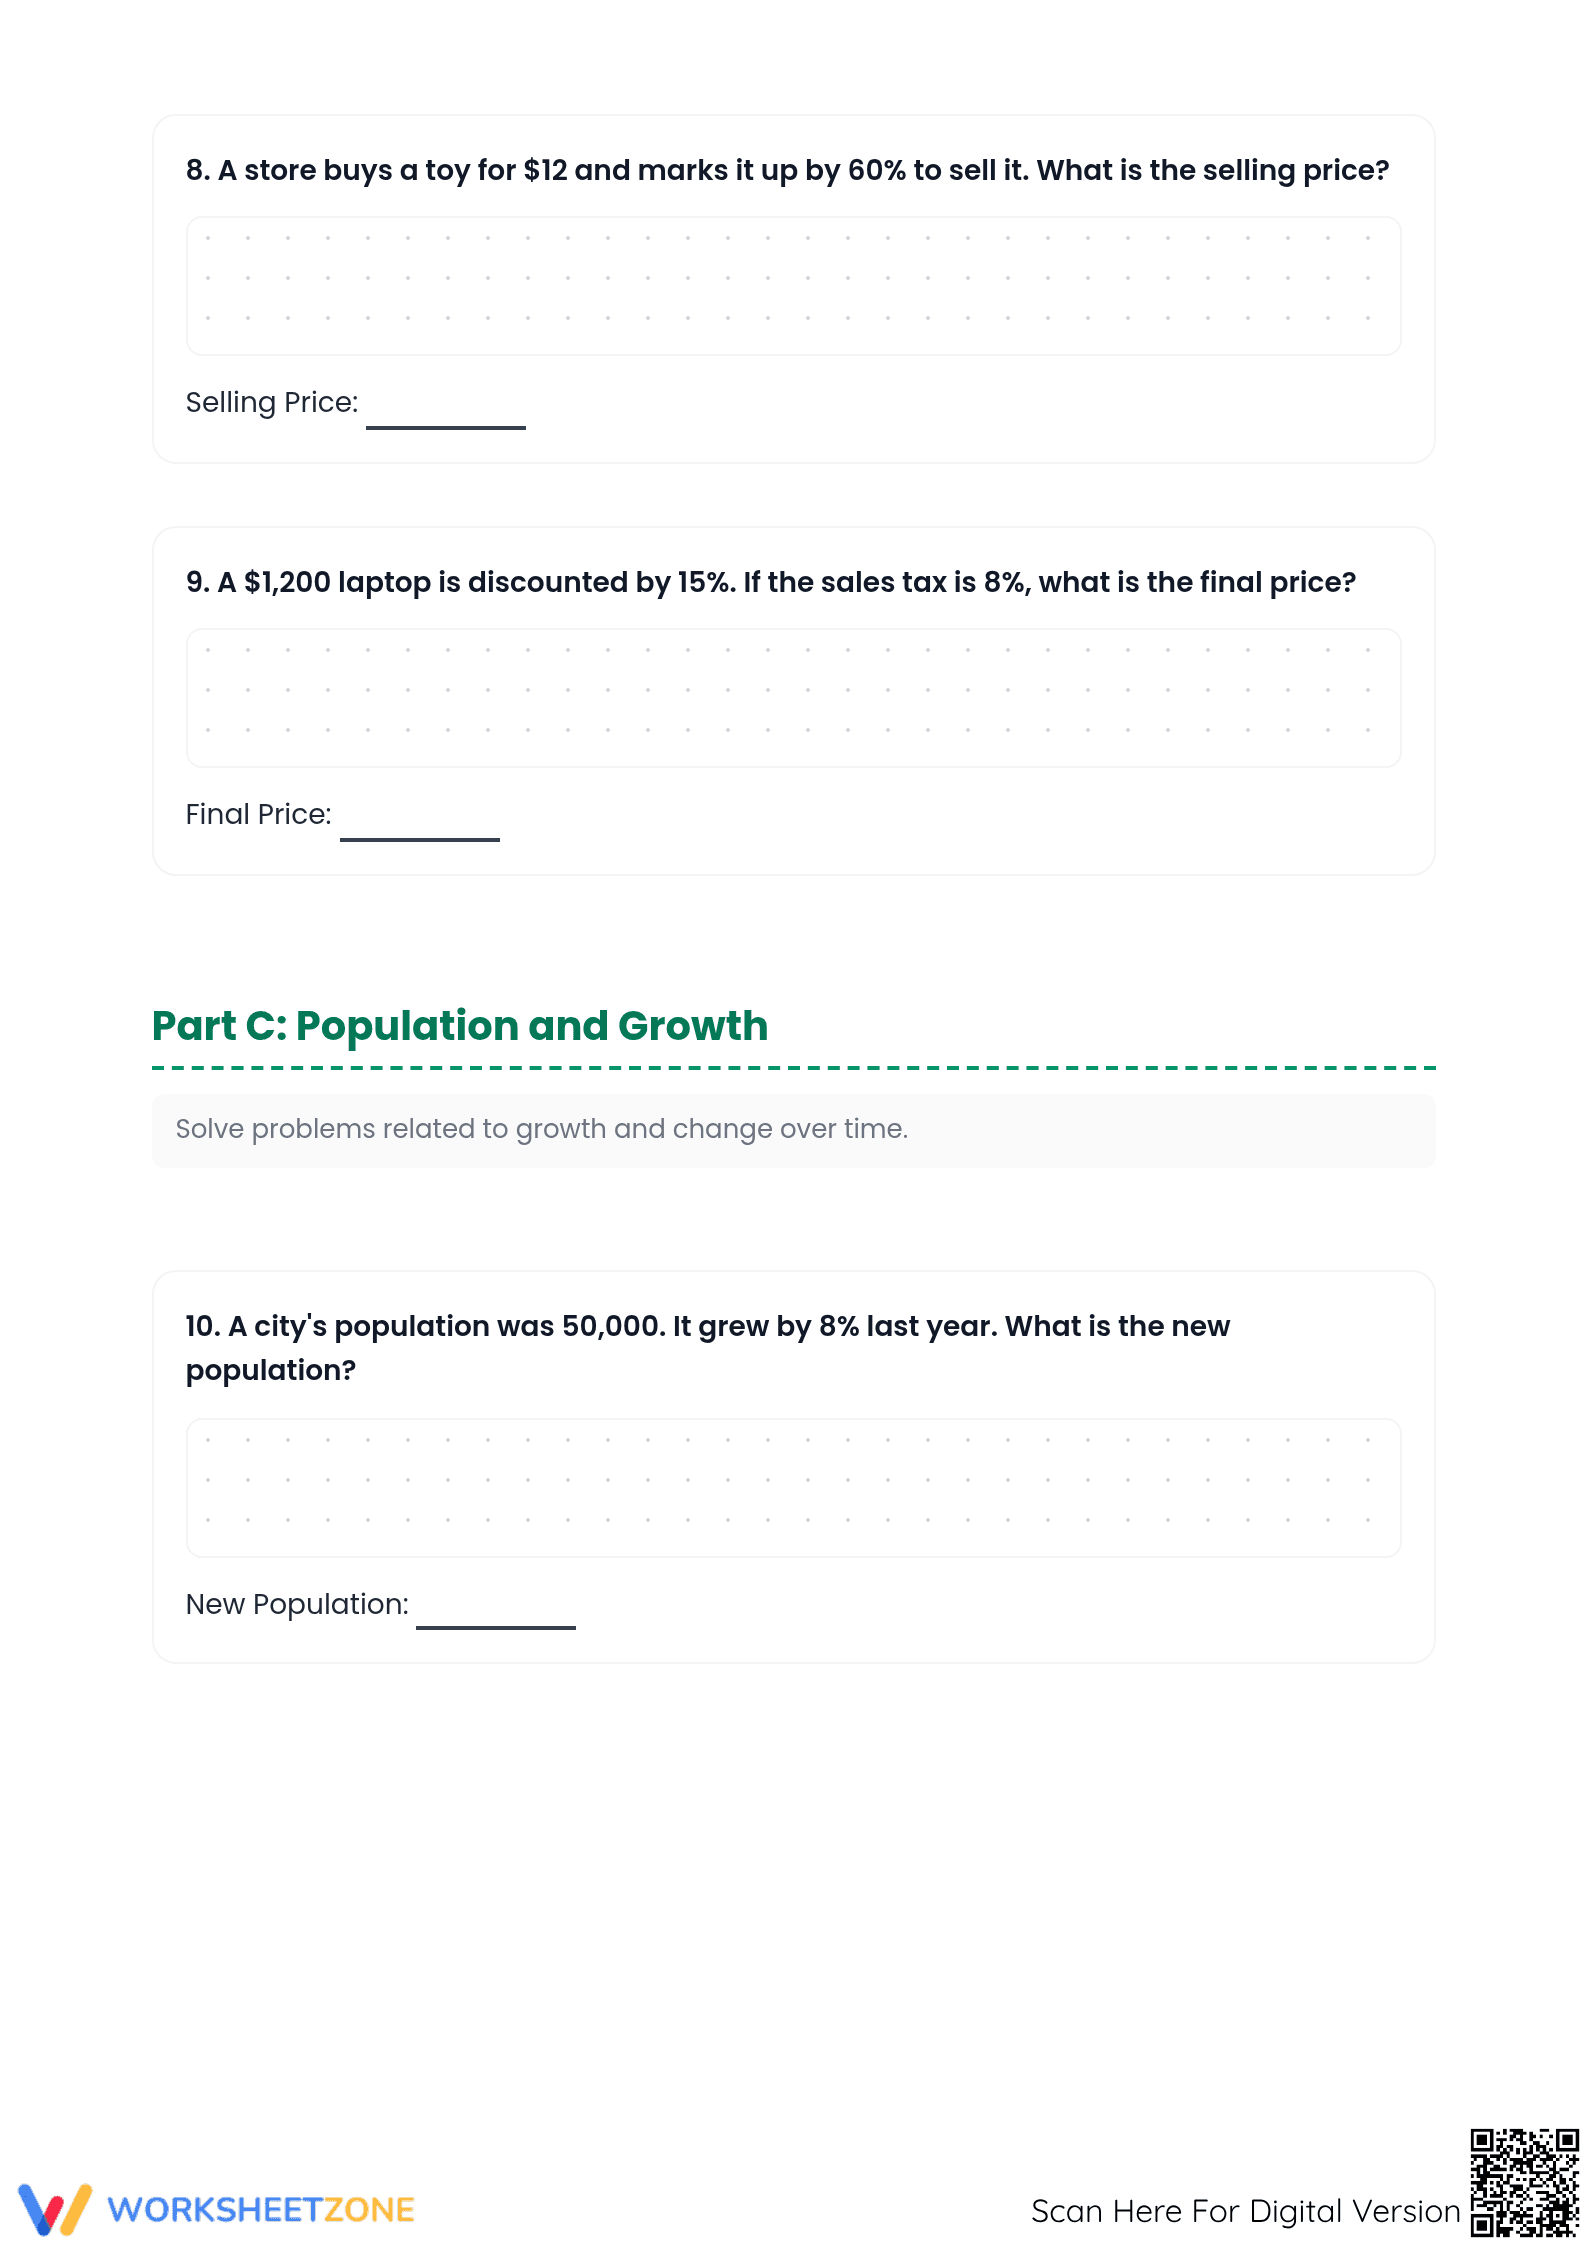
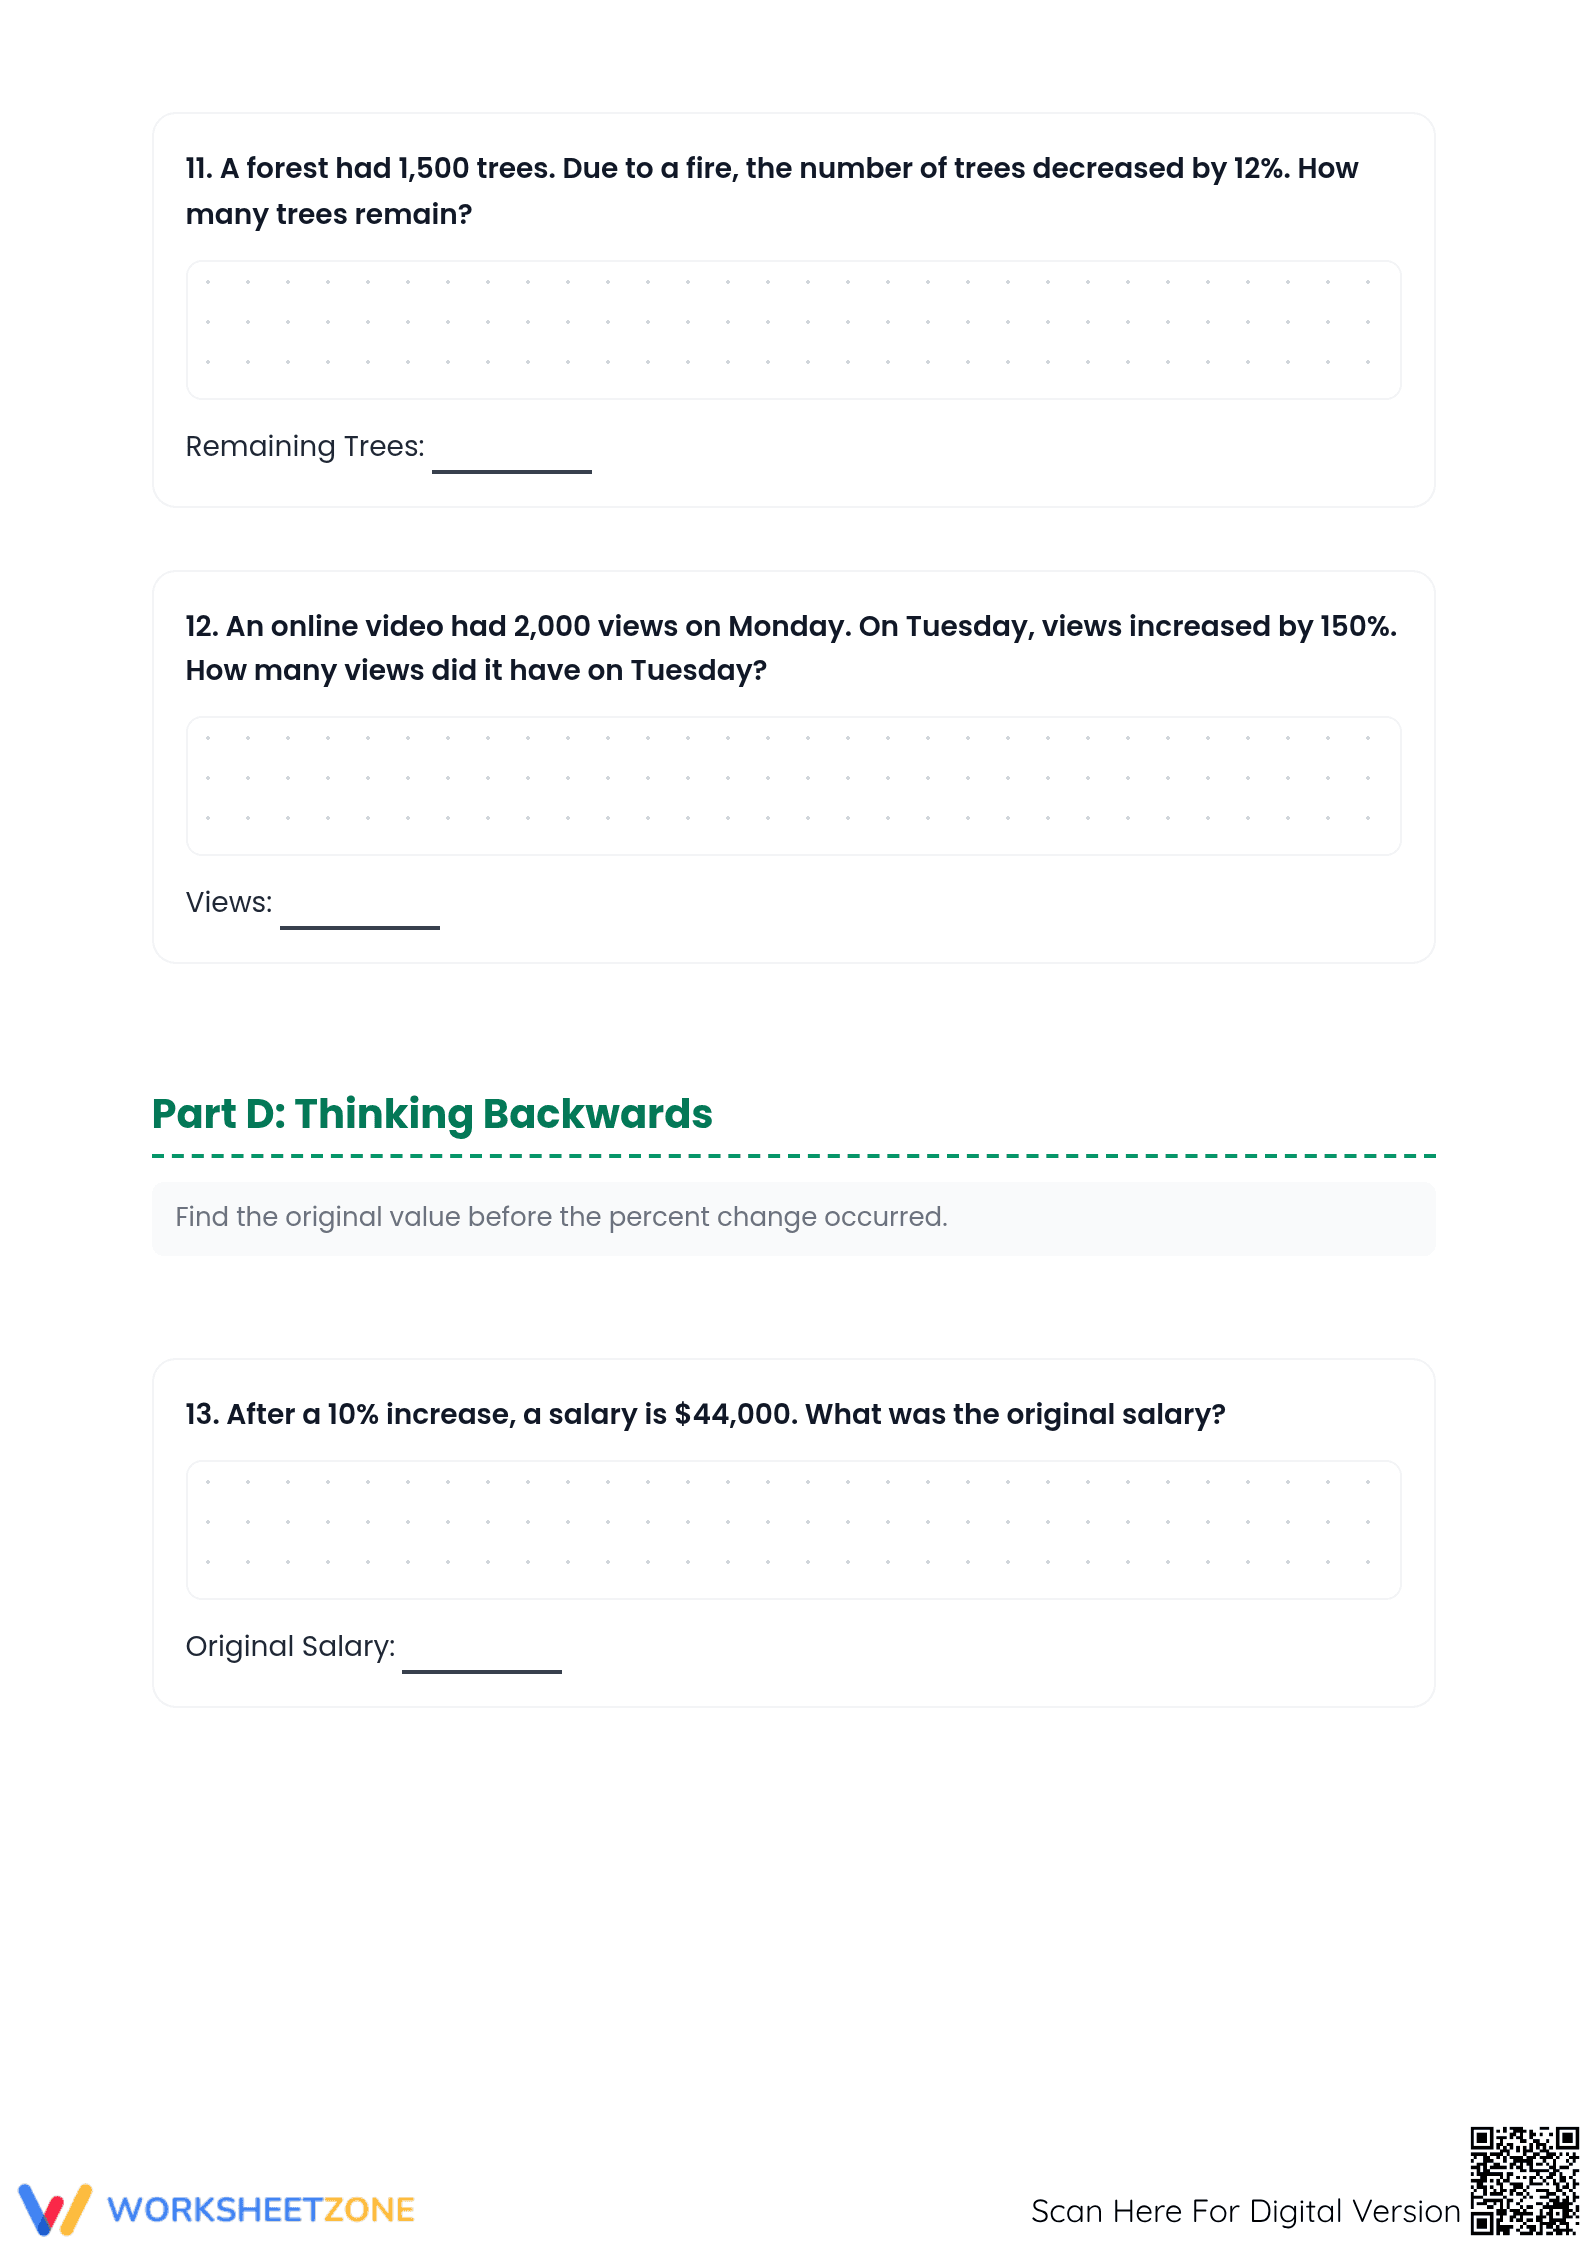
Each task in this set maps directly to specific sub-skills of the 7.RP.A.3 standard. Part A focuses on finding final values after an increase or decrease, establishing the foundational algorithm. Part B transitions to consumer applications, requiring students to interpret terms like "sale price," "markup," and "gratuity." Part C applies the logic to population and growth datasets, while Part D challenges students to "think backwards" using inverse operations to find the original value before a change occurred. This progression ensures that student scores reflect varying depths of understanding, which can be entered directly into gradebooks or IEP progress monitors.
Standards Alignment
The primary focus is `7.RP.A.3`: "Use proportional relationships to solve multistep ratio and percent problems. Examples: simple interest, tax, markups and markdowns, gratuities and commissions, fees, percent increase and decrease, percent error." The worksheet also supports `6.RP.A.3.c` by reinforcing the concept of finding a percent of a quantity as a rate per 100. Both standard codes can be copied directly into lesson plans, IEP goals, or district curriculum mapping tools.
How to Use It
This resource is designed for use during or after direct instruction on percentage change. It functions effectively as a guided practice set where a teacher models Part A before students attempt Part B independently. Alternatively, use it as a summative assessment to gauge mastery of the 7.RP.A.3 standard. Teachers should observe students during Part D specifically, as the ability to calculate the original amount (Thinking Backwards) is a high-leverage indicator of algebraic readiness. Expect students to spend approximately 45 to 60 minutes for full completion.
Who It's For
This packet is optimized for Grade 7 math students but serves as a rigorous extension for Grade 6 or a necessary remediation tool for Grade 8. It is particularly helpful for students who struggle with abstract percent concepts and need the scaffolding of real-world context (e.g., store sales, restaurant tips, city populations). Pair this with a price tag scavenger hunt or an anchor chart on the "Original Value" formula for maximum instructional impact.
The 7.RP.A.3 standard represents a critical shift in middle school mathematics, moving students from basic part-whole relationships to complex multi-step proportional reasoning. According to the RAND AIRS 2024 analysis of mathematical instructional materials, high-quality practice must bridge the gap between procedural fluency and conceptual application. This worksheet achieves that balance by grounding every calculation in a recognizable scenario, from laptop discounts to city growth rates. By requiring students to calculate both the change and the final result, the resource reinforces the additive and subtractive nature of percentage adjustments. Furthermore, the inclusion of inverse calculation problems (finding the original value) provides the cognitive stretch necessary for long-term retention. These tasks align with NAEP evidence standards for mathematical proficiency, ensuring that students are prepared for high-stakes testing environments that frequently utilize these specific real-world contexts to assess deeper quantitative literacy.